
Weekly S&P500 ChartStorm - 29 September 2024
This week: technical checks, Nasdaq, S&P500, equal-weighted, financial conditions, policy pulse, global equities, volatility, seasonality, valuations, great rotations...

Welcome to the latest Weekly S&P500 #ChartStorm!
Learnings and conclusions from this week’s charts:
Topped-tech remains a range trade.
The equal-weighted S&P500 is pushing further higher.
The bull market appears to be broadening out.
(bullish rotation is underway)
However we still have to get through negative seasonality.
Overall, there is a clear bullish rotation underway as the bull market broadens out and new drivers of strength emerge. Easier financial conditions and rate cuts are clearly helping. But of course we can never be satisfied or complacent; seasonality and election uncertainty means we could be in for a bit of volatility in the coming weeks before attention turns to year-end rallies…
REMINDER: the new Weekly ChartStorm Chat-Room is now up and running — I will host a live Q&A session on Sunday evening about 8pm EST.
1. Nasdaq? As an update on that running Nasdaq chart, the index has poked it’s head above that key resistance level, but somewhat unconvincingly so, and still down off the highs — tech has been a range-trade since peaking in July. Yep, that’s right, technically tech has topped; it’s no longer in the driver’s seat. Maybe it hops back in later, but as things currently stand tech is a range-trade.
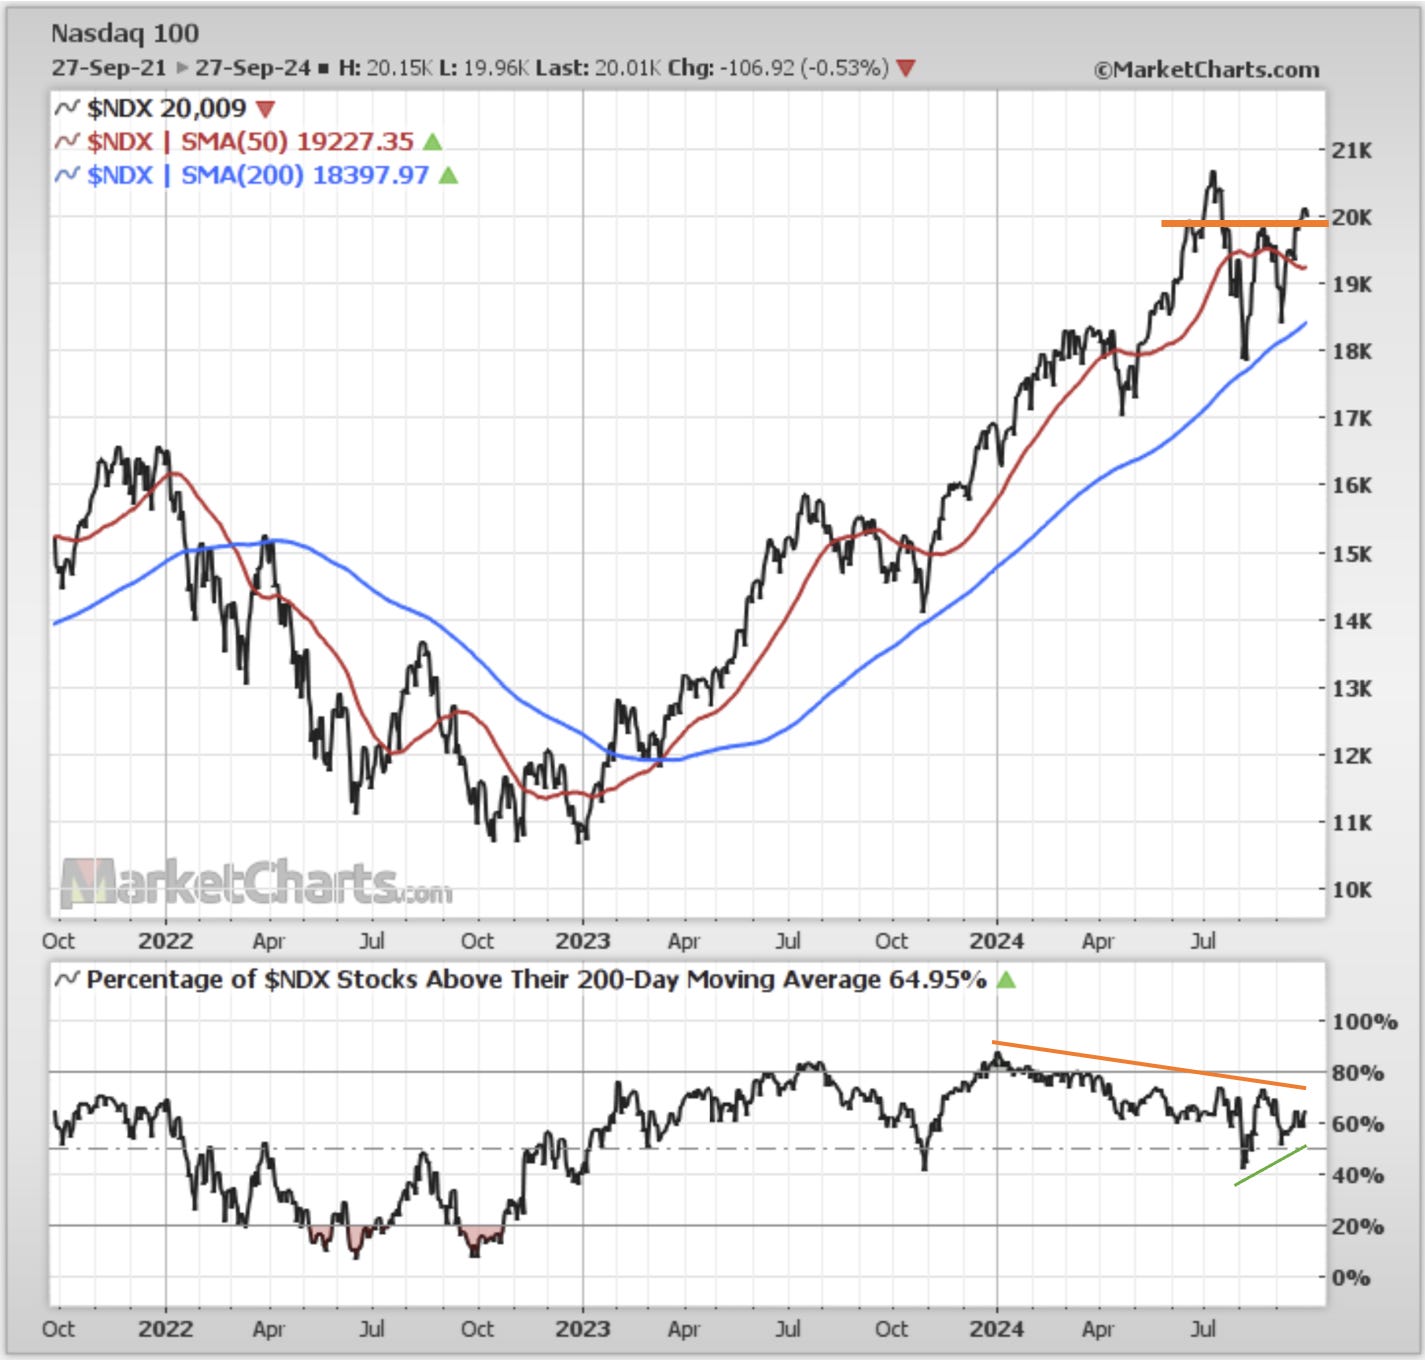
Source: Callum Thomas using MarketCharts.com Charting Tools
2. Speculative Mud: Similarly, Bitcoin —which had been treading a similar path (n.b. we care about path/trend not level in this exercise), has likewise been a range trade since peaking earlier this year. Speculative risk appetite is clearly not the same as it had been earlier in the bull run.
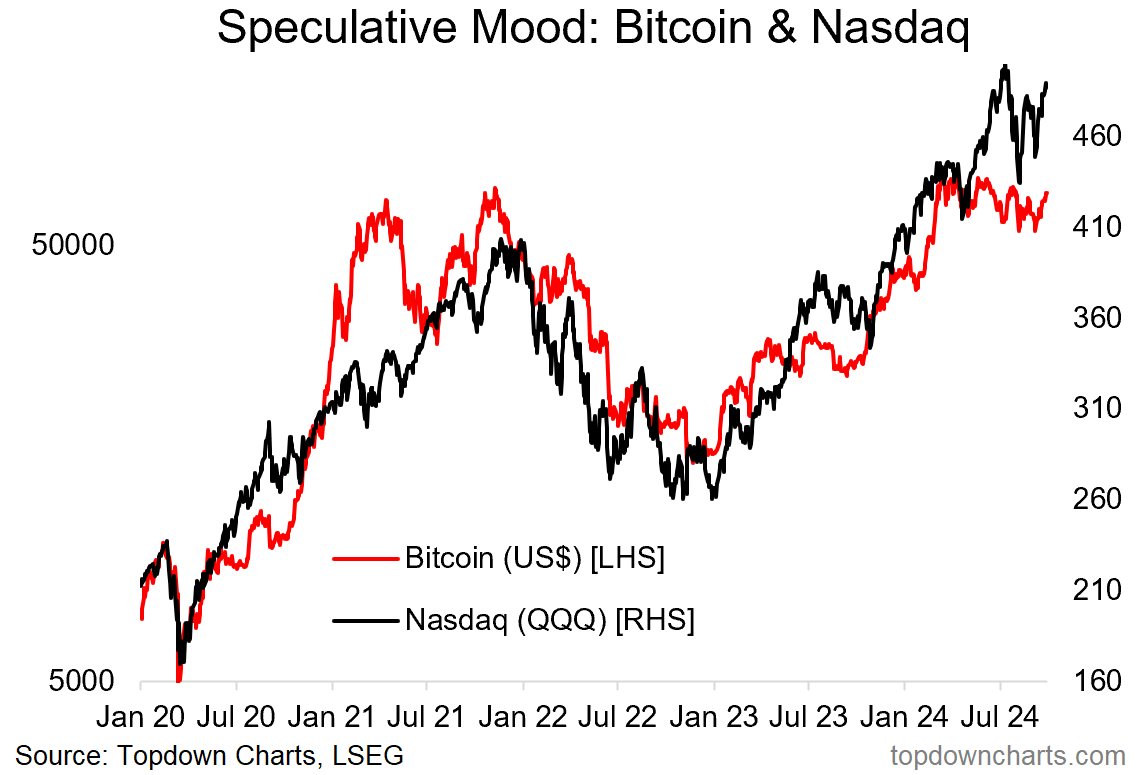
Source: Topdown Charts
3. Meanwhile S&P500: One bright spot though has been the S&P500 — already reclaiming the highs, but especially the equal-weighted version… which in stark contrast to the Nasdaq has been notching up a series of higher highs and higher lows over the same period. This is perhaps the most bullish thing in the charts at the moment: the prospect of “bullish rotation” (see bonus chart section at the end for more on bullish vs bearish rotations).
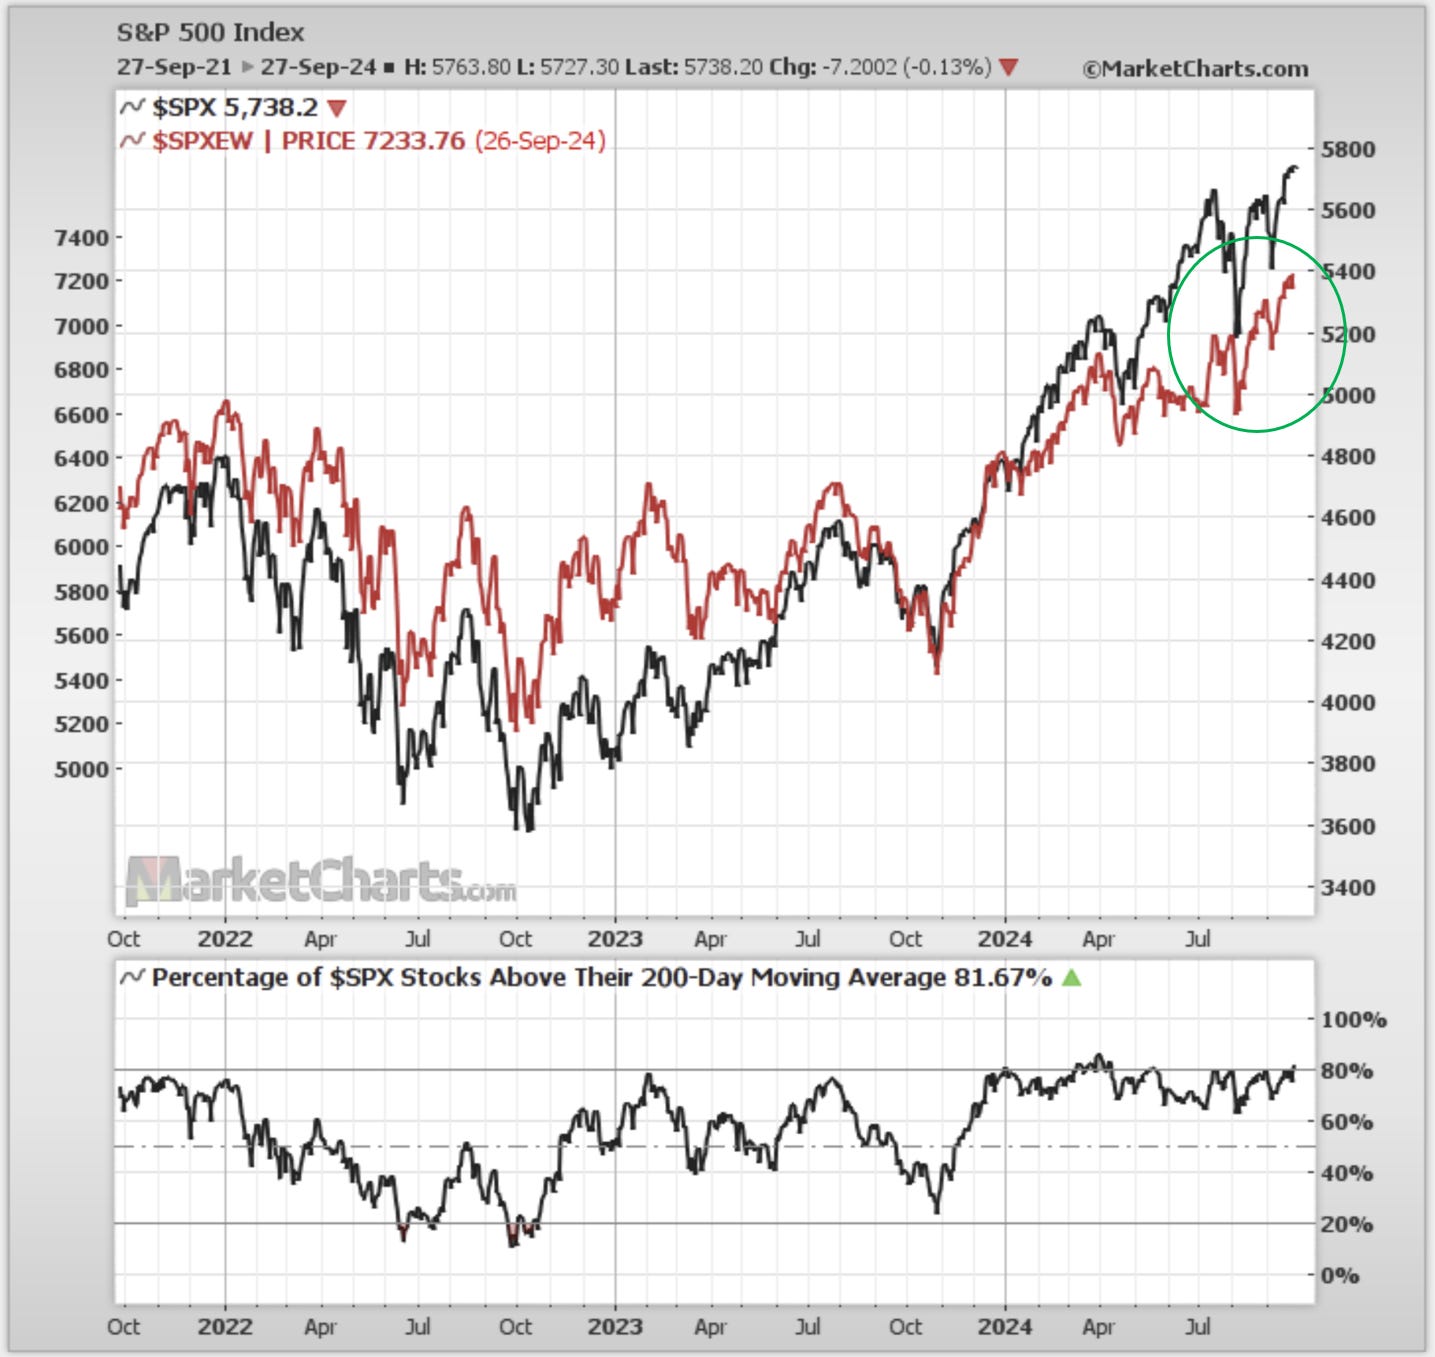
Source: Callum Thomas using MarketCharts.com Charting Tools
4. Great Rotations: Indeed, looking at the equal-weight vs cap-weighted S&P500, there is a clear turnaround underway from 2009 levels (and from a point where the relative performance line had significantly deviated from trend [NOTE: the normal thing is for equal-weight to beat cap-weight — what we saw over the past year was actually abnormal].
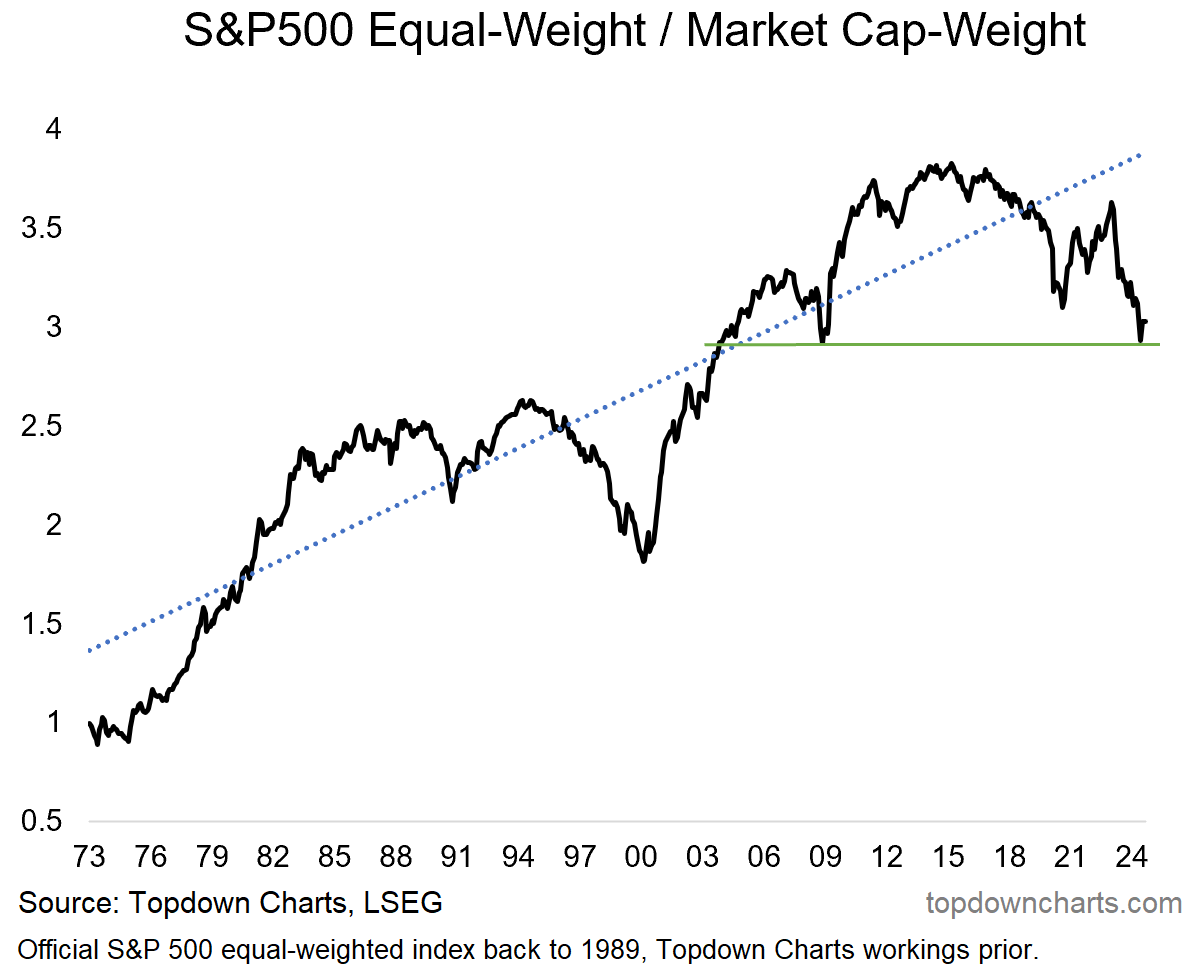
Source: ChartStorm Perspectives Pack
5. Easing Financial Conditions: In terms of what’s helping drive the S&P500 higher, a key part of it is the general easing of financial conditions (weaker dollar, lower yields, cheaper energy …also stronger gold; reflecting easier monetary conditions overall). All this along with rotation and catch-up is why the S&P is doing better than the expensive and consensus tech trade.
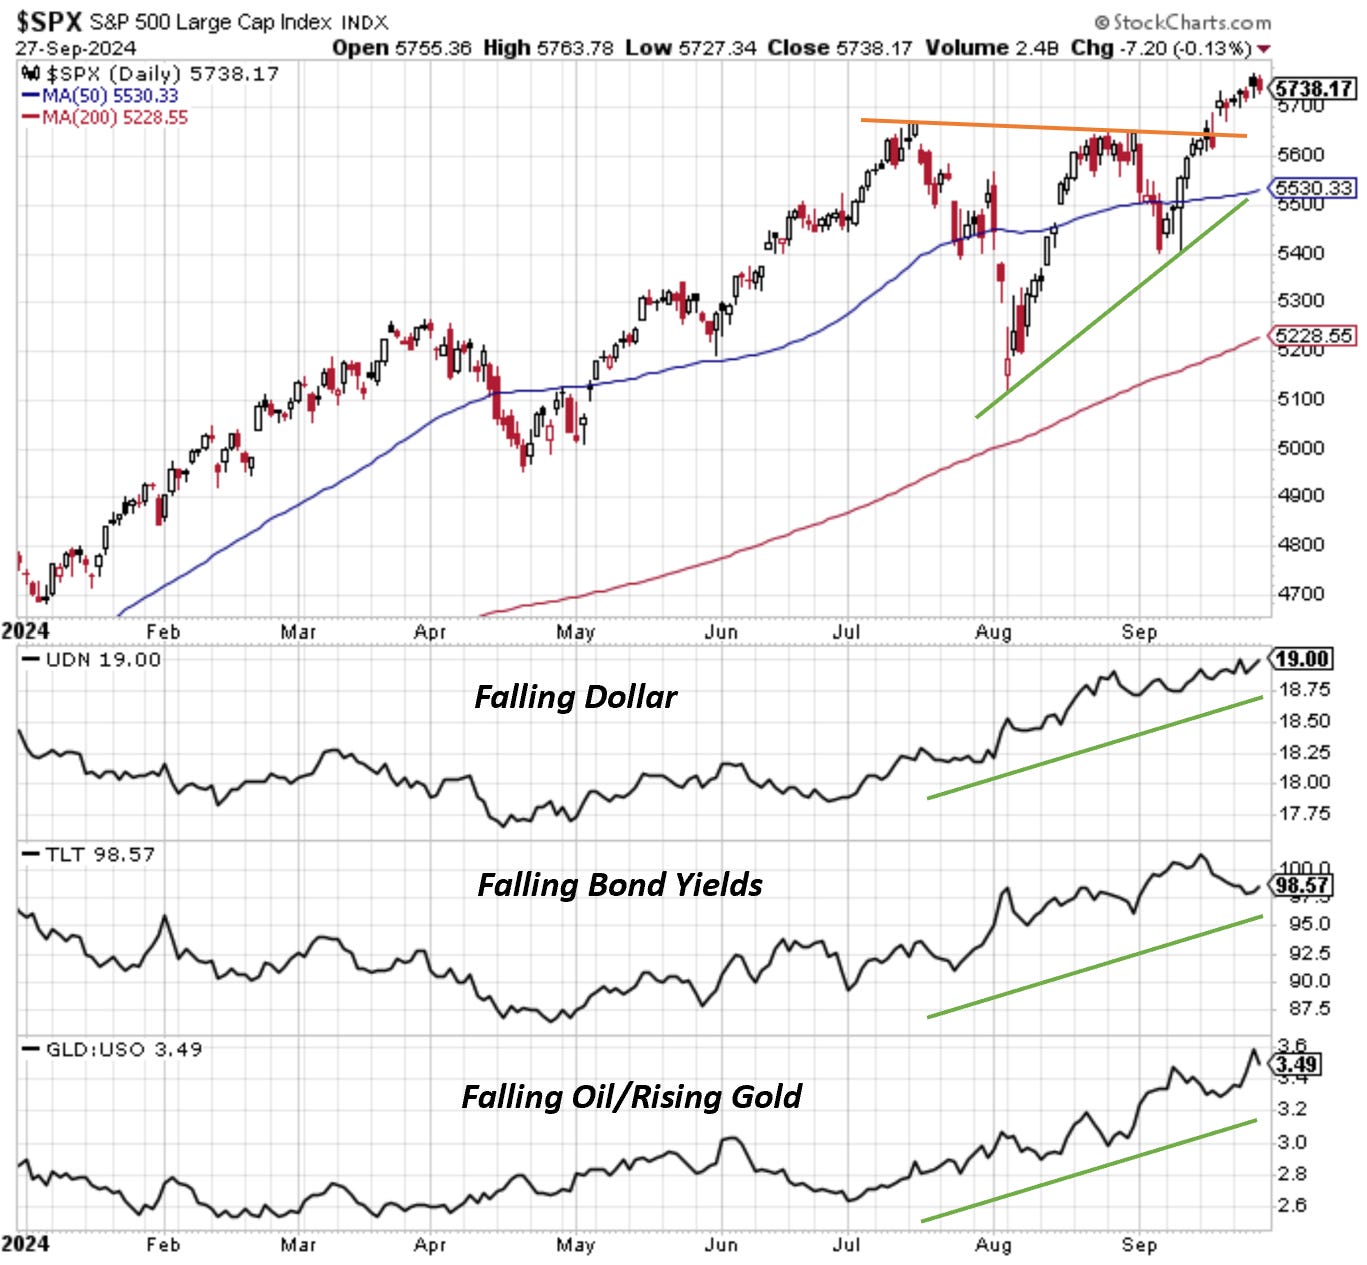
Source: @Callum_Thomas using StockCharts.com
6. Global Policy Pivot: On the topic of monetary easing and broadening bulls, it’s not just the Fed pivoting to rate cuts, we have seen a global mass-migration by central banks from rate hikes to rate cuts. While there are other factors at play, it’s easier for global equities to rally when central banks are cutting interest rates.
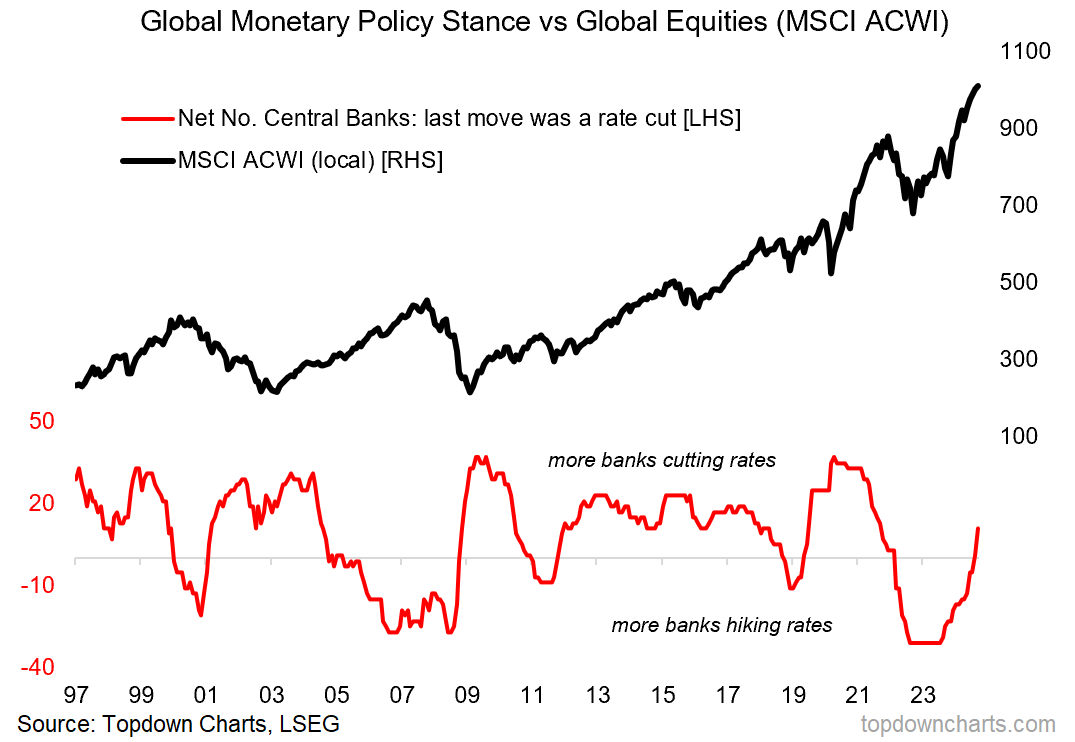
Source: Topdown Charts Professional
7. Broadening Bull: Another part of the broadening bull theme has been the breakout in Global ex-US equities. As shown below the global ex-US index has broken through a major long-term overhead resistance level —with solid breadth. This is basically a situation of a cheap relative value opportunity meeting the right catalyst at the right time, and adds to the bullish rotation theme.
