
Weekly S&P500 ChartStorm - 29 January 2023
This week: the breakout! risk managing up, year of the rabbit, margin debt, soft vs hard landings, earnings outlook (vs expectations), tech bubble burst perspectives, and smart money positioning...

Welcome to the Weekly S&P500 #ChartStorm — a selection of 10 charts which I hand pick from around the web and post exclusively on Substack.
These charts focus on the S&P500 (US equities), and the forces and factors that influence the outlook - with the aim of bringing insight and perspective.
1. That Trendline Chart Again: I was reluctant to include this as I reckon everyone is sick of it it by now, but it seems we have (at least for now) some kind of resolution. Clearly this looks like a bullish resolution, with the index breaking out vs its 200-day moving average and vs that trendline. But in case you thought it was going to be simple, we still haven’t cleared the Nov/Dec highs, and next week we’ve got the Fed — and they are probably not thrilled with the significant easing of financial conditions that has taken place (…and by now everyone seems to be hanging their hat on a Fed pivot/pause, so any hint of hawkishness will probably confound the simplicity of a chart like this).

Source: Topdown Charts @TopdownCharts
2. Exposed: As you might expect, active risk managers have been actively increasing exposure to equities — I would say most of this is about reducing shorts vs chasing gains (as an exercise in managing risk given the emerging bullish technical evidence).
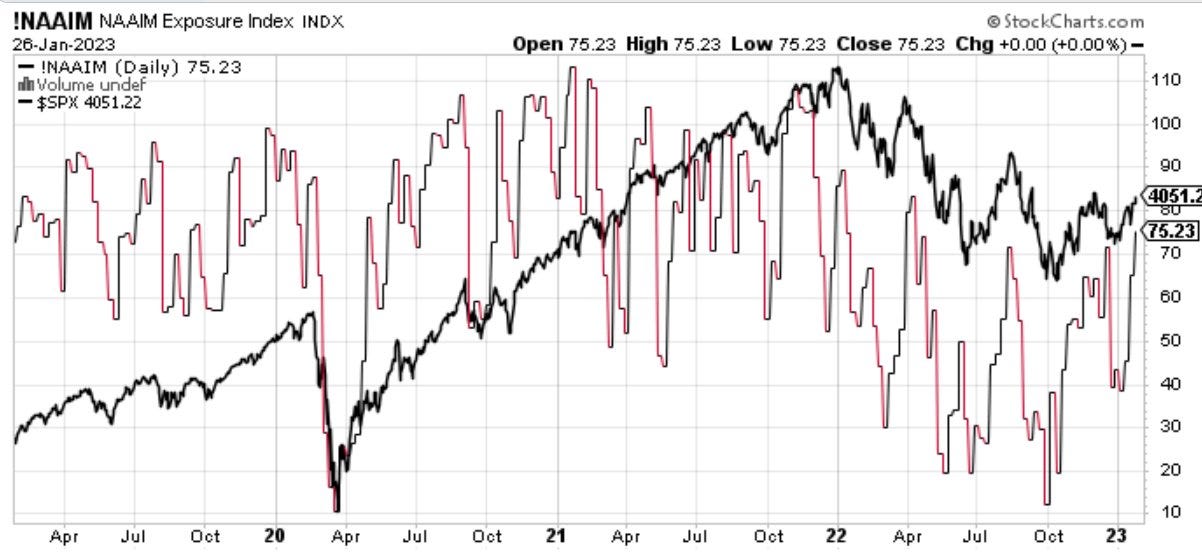
Source: @TheShortBear
3. Year of the Rabbit: Happy Chinese New Year! …and it may indeed be a happier year given the historical stats — previous years of the rabbit ended higher 83.3% of the time, and this contrasts with last year’s Tiger, which was only 57.1%.

Source: @RyanDetrick
4. Margin Debt Divergence: This is an intriguing divergence, and I would say a key cautionary against going full bull too soon. The latest data shows margin debt is not confirming the rally in stocks. We saw this type of thing play out in 2008 and 2002 (and 2019). By itself, this is an interesting chart, but when you consider the next few charts it becomes all the more relevant…
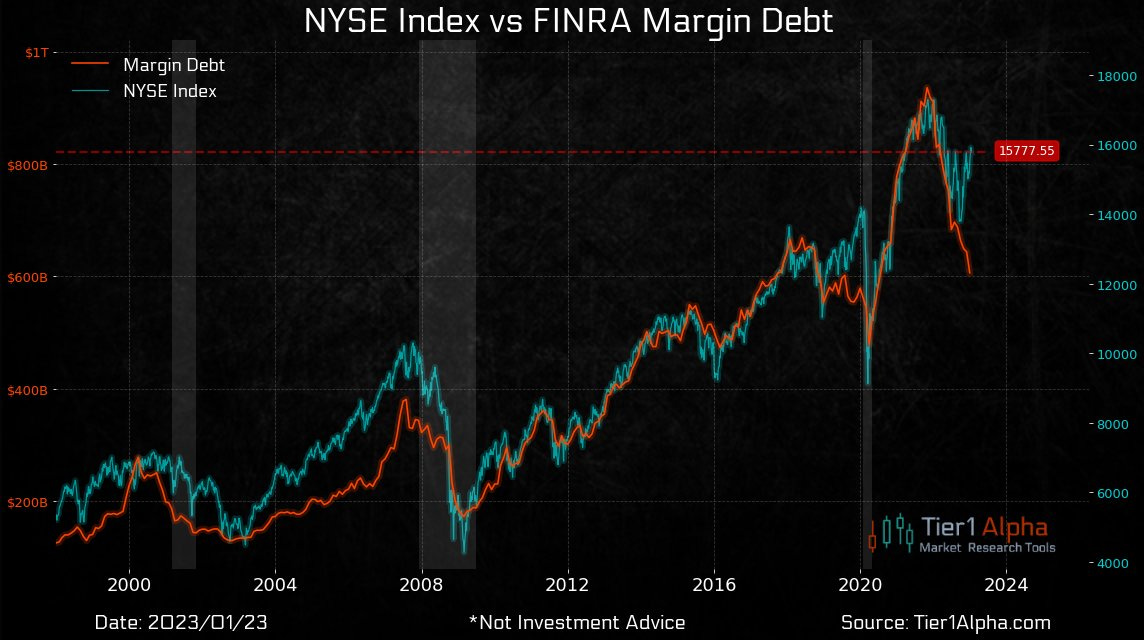
Source: @t1alpha
