
Weekly S&P500 ChartStorm - 28 June 2026
This week: the "lag-7", valuations, earnings euphoria, sector sizes, tech sector, foreign flows, market regimes, small caps...

Welcome to the latest Weekly S&P500 #ChartStorm!
Learnings and conclusions from this week’s charts:
Mag-7 has become Lag-7 (almost -20% performance gap).
Across a number of indicators valuations look expensive.
Strong earnings expectations are supporting high valuations.
Tech stocks have become the dominant sector on many metrics.
After a long period of trending, a period of ranging is “overdue”.
Overall, the bullish rotation theme remains in play as Mag-7 loses and the S&P493 wins. But in this edition we explore the bearish interpretation where the Lag-7 might actually be a harbinger (even if it manages a short-term rebound rally).
1. Mag-7 vs the Rest: the divergence widens —Mag-7 is increasingly being rebranded as the Lag-7 as Mag-7 dropped -14% from the 14th May peak (vs ex-Mag-7 up +5% over the same period). But note that tick-up from oversold levels on Friday.
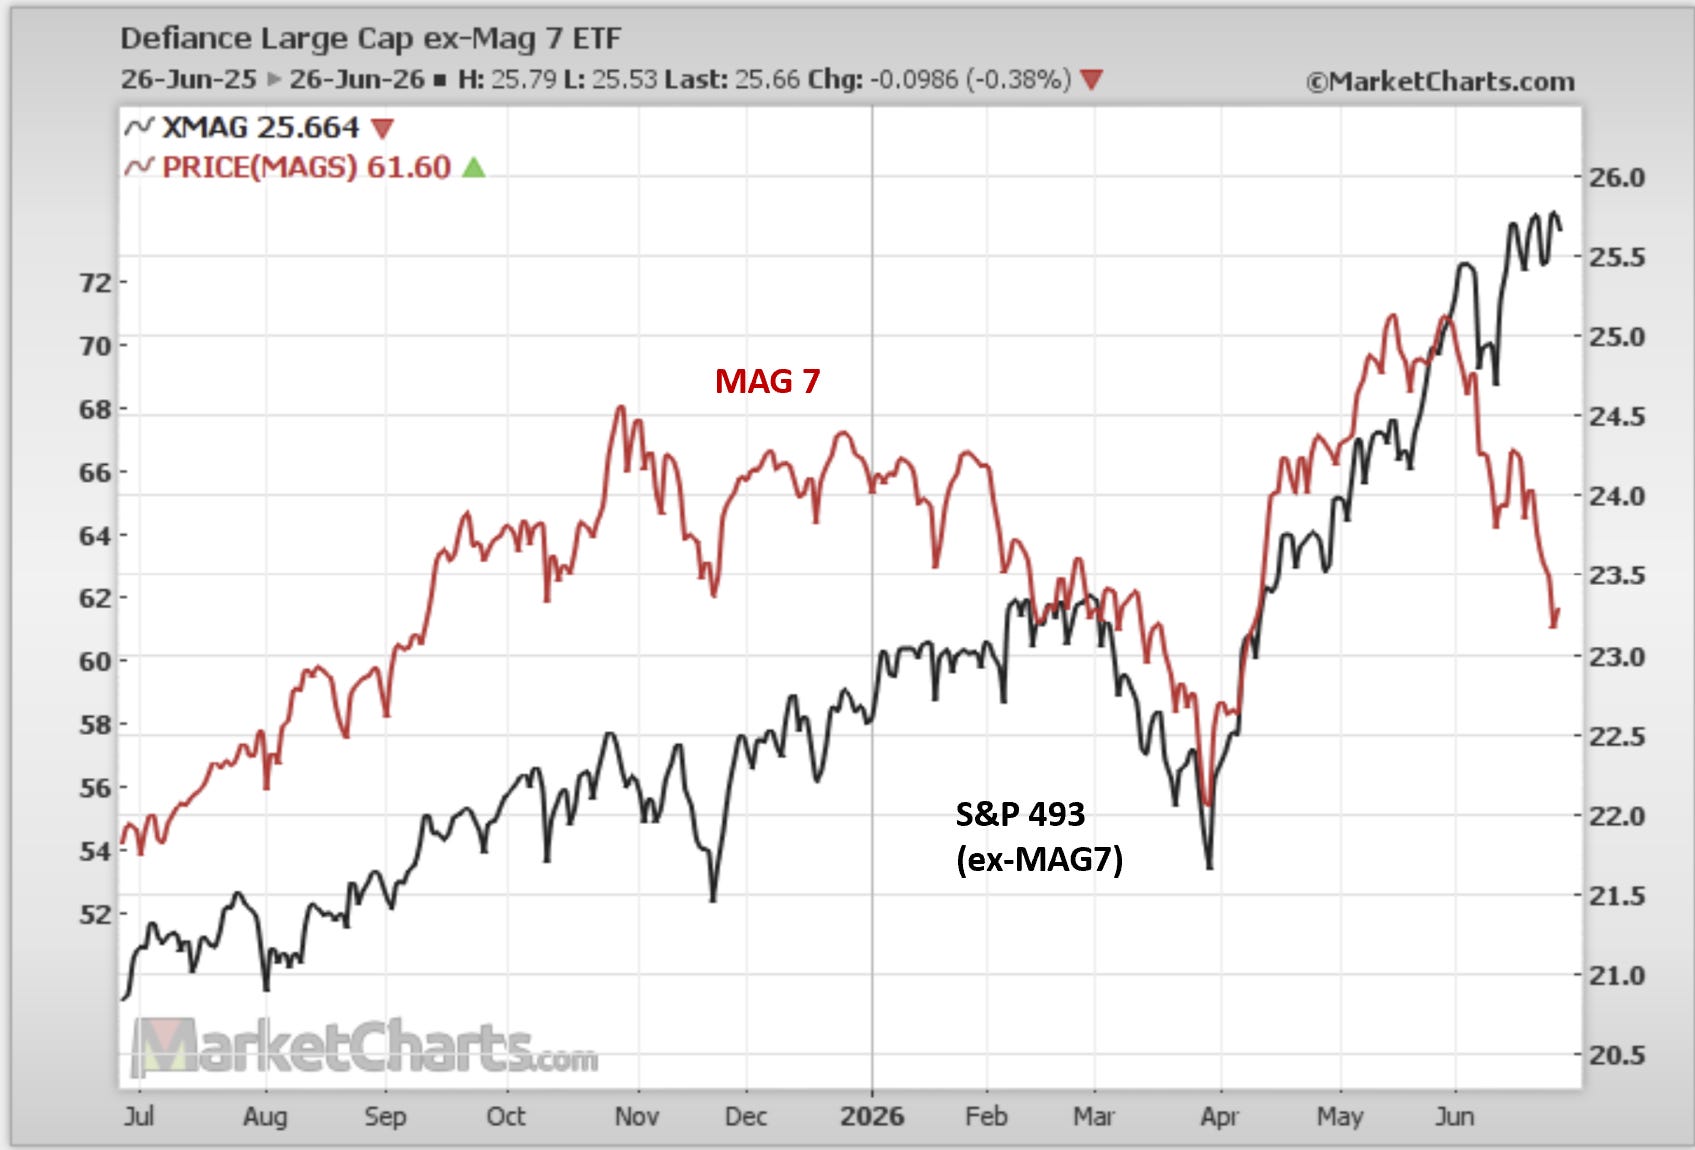
Source: MarketCharts.com
2. Lag-7: also of interest is how significantly the Mag-7 have fallen behind vs the Nasdaq-100. I think this speaks to; a. the bullish rotation theme (that the “S&P493” has managed to push higher); b. the oversold conditions in Mag-7 (the potential for a rebound rally); and c. whispers of peak-risk (after-all if the former leaders of the big tech-led bull market are coming undone, that’s a pretty significant warning sign).
(p.s. all 3 might be right, but just a matter of sequencing…)
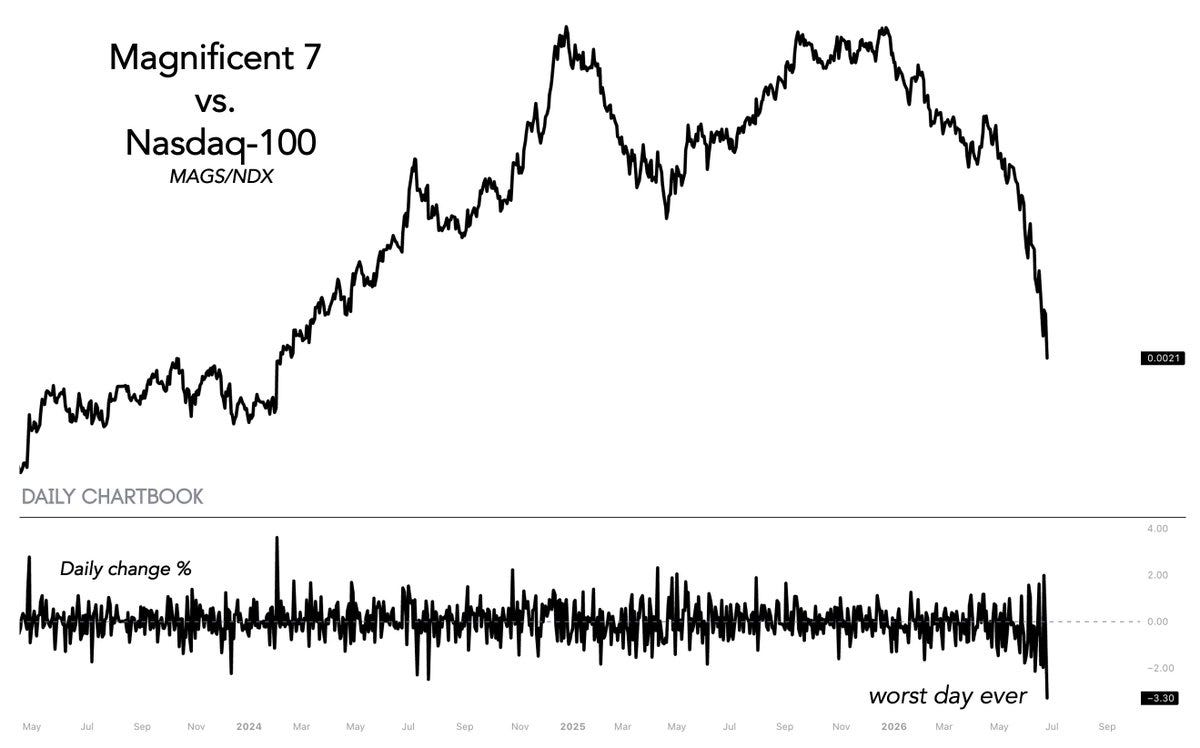
Source: @dailychartbook
3. Inconvenient Charts: I previously talked about how the bullish interpretation is rotation (investors rotate out of former leaders into former laggards), and that is actually what we are observing out there at the moment.
But let’s explore the bear case…
