Weekly S&P500 ChartStorm - 28 January 2024
This week: market euphoria, all-time highs, rate cuts, used cars, revenues, valuation metrics, it's different this time, price-to-AI, bullish medium-term indicators...
Welcome to the latest Weekly S&P500 #ChartStorm!
Learnings and conclusions from this week’s charts:
Sentiment is surging as further new all-time highs are reached.
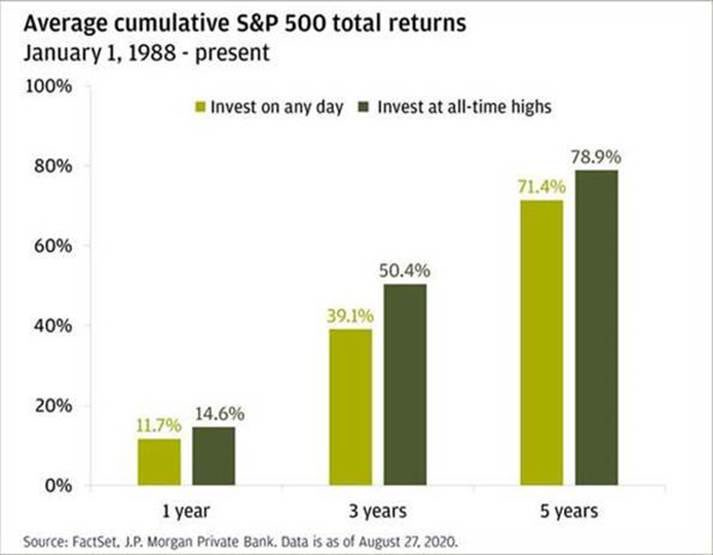
Historically, buying at all-time highs had a slight performance edge.
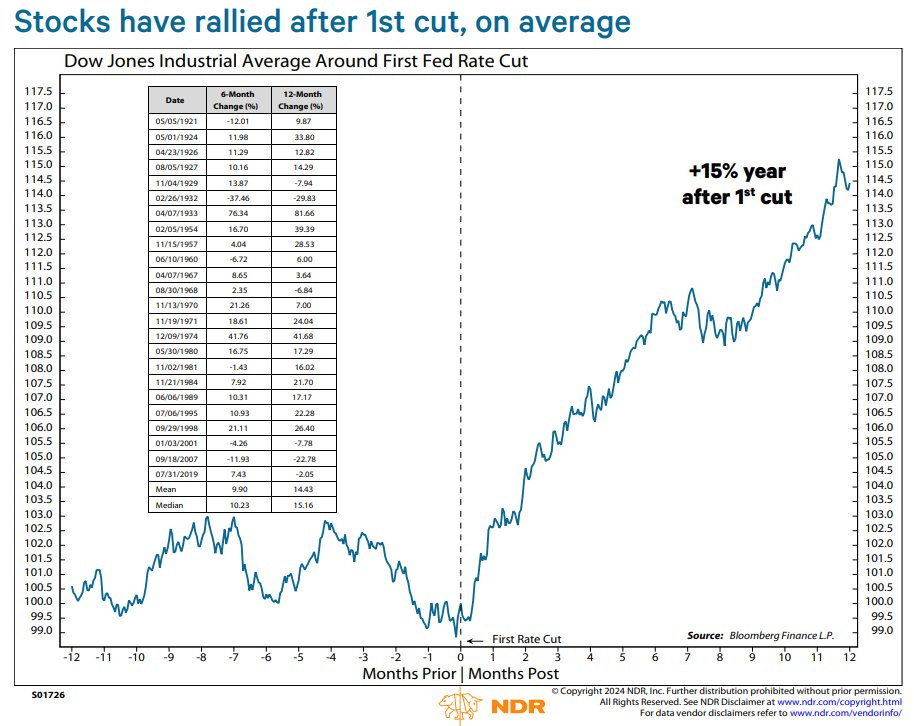
It’s not entirely unusual for the Fed to cut rates near all-time highs (also rate cuts are generally bullish, with some notable exceptions).
Sales growth is slowing, and may slow further this year.
On nearly all metrics, the S&P 500 is showing up as expensive.
Overall, the market party continues. The bulls will be focused on the prospect of rate cuts, the new all-time highs, and the various medium-term bullish cycle indicators. The few remaining bears meanwhile will be focused on expensive valuations, increasingly bullish sentiment, and (mixed) signs of slowing growth. Makes you think the path of least resistance is probably higher, even if uncomfortably so.
1. Euphoria Rising: As the S&P 500 pushes forward into new all-time highs, the “Euphoriameter” has continued its recovery from previously depressed levels. It’s funny, you look at a chart like this, and at least in terms of timing the bottoms, you could have ignored just about everything else and just waited for this indicator to drop to the lows and tick up again (and another couple charts like this in the bonus chart section). As for now though, it’s still rising, but not yet excessive, and has not yet peaked (in terms of sentiment indicators, the danger is when they become stretched and/or turn the corner).
Source: The Euphoriameter Topdown Charts Professional
2. Buy the All-Time High: Or BTFATH as some call it — historically, there is a slight performance edge in buying on days the market reached an all-time high.
Source: @PeterMallouk via The Chart Report
3. Rate Cuts at the All-Time High: Conventional wisdom says the Fed only cuts rates when there are problems, but interestingly, if you look at the period since 1980, there have been 20 rate cuts when the market was within 2% of the ATH. And at least during that period, markets were higher a year later 100% of the time. So perhaps the takeaway is that if the Fed does cut rates (and that is still a big **if**), and the market is still tracking close-to or at the ATH, then it will probably be bullish.
Source: @RyanDetrick
4. Rate Cut Rise: Looking further back in time, with a couple of notable exceptions (e.g. 1932, 2001, 2007), the stock market typically moves higher after the first rate cut. Thinking about those exceptions, you basically need a fairly disastrous backdrop to break this rule of thumb.
Source: @edclissold
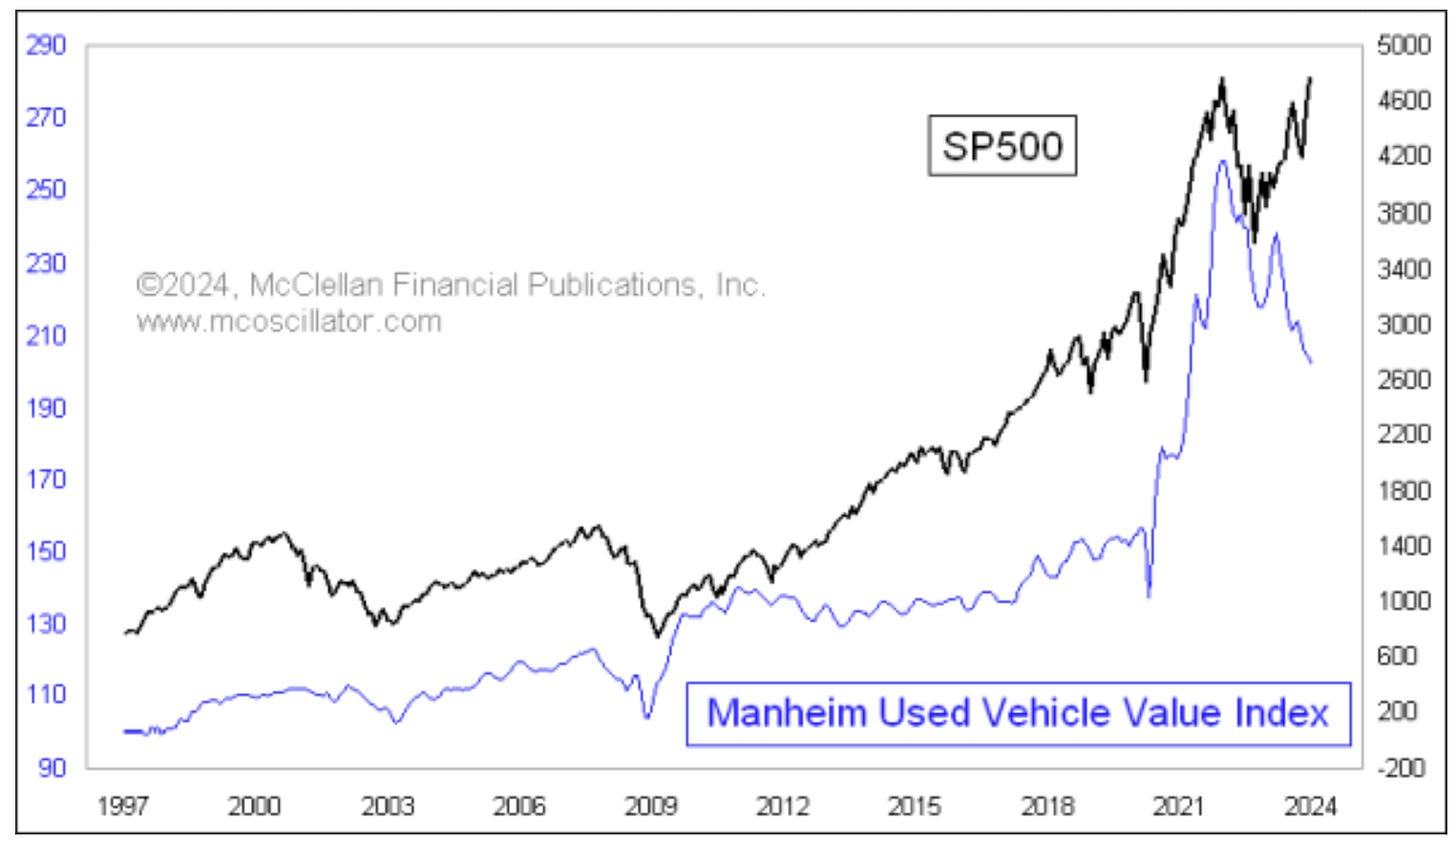
5. Stock Prices vs Car Prices: I’ll let you draw your own conclusion on this divergence, and leave you with the question — is 2024 a good time to sell stocks or buy a used car? (or both?!)
Source: Chart In Focus — Manheim Used Vehicle Index
6. Sales Slump: While you might argue there is an element of base effects at play in this one, the truth is that inflation is coming down, and that means nominal growth is going to be slower, and ultimately sales growth at the aggregate is going to be slower (at the limit, sales growth is basically nominal growth).


