Weekly S&P500 ChartStorm - 26 November 2023
This week: market perspectives, winners and losers, seasonality, financial conditions, euphoria, bearishness, interest expense, capex boom, valuation realities...
Welcome to the latest Weekly S&P500 #ChartStorm!
Learnings and conclusions from this week’s charts:
With 24-trading days left in 2023, stocks are on track for solid gains for the year (vs bonds on track for their 3rd annual loss in a row).
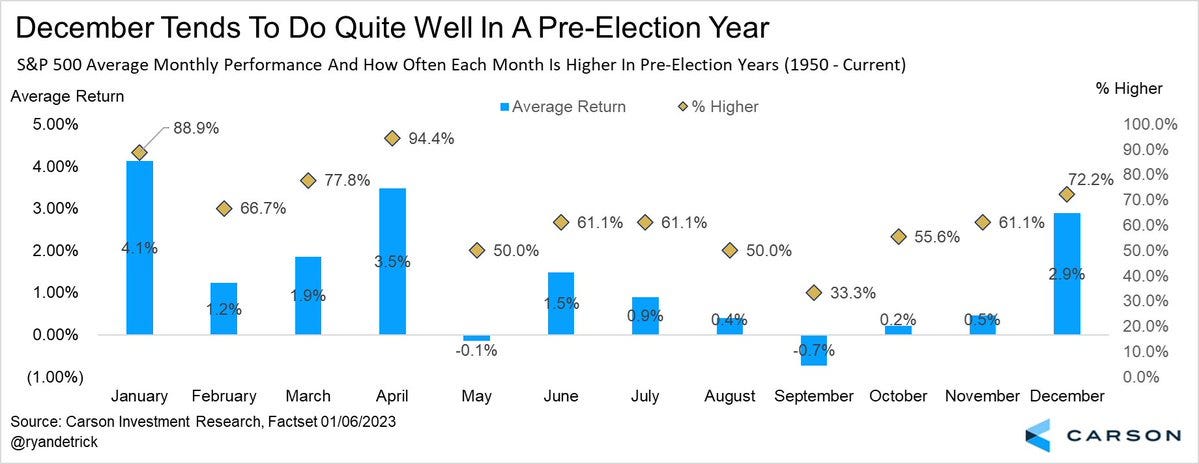
Heading into December seasonality is strong and sentiment surging.
Listed company interest expense is rapidly rising (and headed higher).
Re-shoring may be part of a capex crash-helmet for the economy.
Stocks are definitely not cheap (expensive on most measures).
Overall, the rally off the October low (the 2023 October low) has been sharp, significant, and almost basically a straight-line up. We know there is good reason for this — i.e. previous pessimistic sentiment meeting significant easing of financial conditions. But with both of those things running their course, and valuations still expensive, it does leave some questions as to the next steps…
1. Zooming Out: I usually like to start things off with a short-term/technical look at the markets, but this time a longer-term perspective piece as we head into the final stretch of the year... While there are still 24 trading days left in 2023 (and anything could happen), bonds look set to deliver their 3rd annual (calendar year) loss in a row [n.b. the chart shows YTD figures for 2023]. Meanwhile stocks have bounced back into positives, and here’s an interesting hidden object puzzle for you — how many times did stocks drop after rebounding from a loss?
Source: Topdown Charts Topdown Charts Research Services
2. Booms and Busts: In the wake of the 2020 stimulus driven booms & busts, here is how things are presently sitting — the more junky end of the boom stuff (e.g. those stupid meme stocks, scam-adjacent SPACs, and who would think: non-profitable tech) remain mired in deep drawdown, while Bitcoin and Mag 7 (Big Tech) are top of the table. Food for thought as 2024 draws near: how will the leader/loser rankings change in the coming 12-months?
Source: @TimmerFidelity
3. December is Coming: Back into the current market moment, while November is already up almost 9% with little pause in the path from the October low, it’s interesting to note that December has historically been one of the best months of the year. Will it be the same this year? (or the bear take: maybe we already banked that this month…)
Source: @RyanDetrick
4. Untightening: A big driver of the gains from the October lows has been the substantial easing of financial conditions (thanks to lower bond yields, lower oil prices, weaker USD, tighter credit spreads). In this respect there is a fundamental aspect to it, but how much further can things ease on this front?
Source: DailyShot via @LanceRoberts
5. Euphoria Heights: The rally off both October lows (the 2023 October low, and the original 2022 October low) has triggered a return of Euphoria reminiscent of what happened at the start of some of the most significant cyclical bull markets in recent decades (albeit, n.b. the S&P500 has yet to make a new high).
Source: The Euphoriameter by Topdown Charts Professional
6. Bear No More: This chart shows the collapse in bearish readings for US equities in the Sentix surveys — one interesting aspect on this chart is that it doesn’t necessarily seem to be a contrarian indicator. In other words, this crowd seems to correctly become less bearish when things are turning up vs peaking, as such.


