
Weekly S&P500 ChartStorm - 26 January 2025
This week: financial conditions, semiconductors, credit spreads, valuations, recessions, analyst coverage, sector skews...

Welcome to the latest Weekly S&P500 #ChartStorm!
Learnings and conclusions from this week’s charts:
The pause in financial conditions tightening helped stocks rally.
Semiconductors’ market cap weighting reached an all-time high.
Mag7 corporate bond yields are almost on par with Treasuries.
Credit & Equity markets are extreme expensive, complacent.
Passive index investors are all-in on tech, light on defense.
Overall, in the short-term the pause in financial conditions tightening has helped stocks rally off oversold levels —perhaps along with some renewed optimism on what the year ahead might bring, and golden age, AI etc. But I think we need to remain on guard and on-watch with regards to financial conditions; a resumption in tightening will risk triggering off some of the significant vulnerabilities building up in markets (which I have documented in detail this week!)
1. Financial Conditions: First up is a look at some intermarket analysis; arguably what’s been behind some of the recent market weakness has been rising bond yields (TLT, bond prices, as a tracker for this in the chart below), strong dollar (UDN, inverse USD), and rising oil prices (SCO, inverse crude oil). Basically, if you get a surge in US dollar, bond yields, and crude oil — that’s a tightening of financial conditions, a headwind for the economy and risk-taking, and at a certain point stocks come under pressure. So I think this chart will be key to keep watch on as they are all rebounding at the moment, and taking some pressure off stocks: question is for how long.

Source: Callum Thomas using StockCharts
2. Semiconductors: A big driver of the AI-hype bull market has been strength in semiconductors (at least up until they peaked as a sector about middle of last year). I think this year is going to be a potential moment of truth for this part of the market. On the one hand you have the “AI Manhattan project” where a consortium of AI players have pledged to invest some $500B, on the other hand there’s the just-released Chinese breakthrough model DeepSeek… which has demonstrated the success of open-source models and greater efficiency (maybe you don’t need mega datacenters, or at least as many as we thought). Then there’s the remaining open question of how do you even commercialize AI, and competition will bring pressure down on any profit margins that can be generated — I think what this adds up to is perhaps a period of rethinking on capex, earnings prospects, and maybe a shakeout in some of the excesses here.
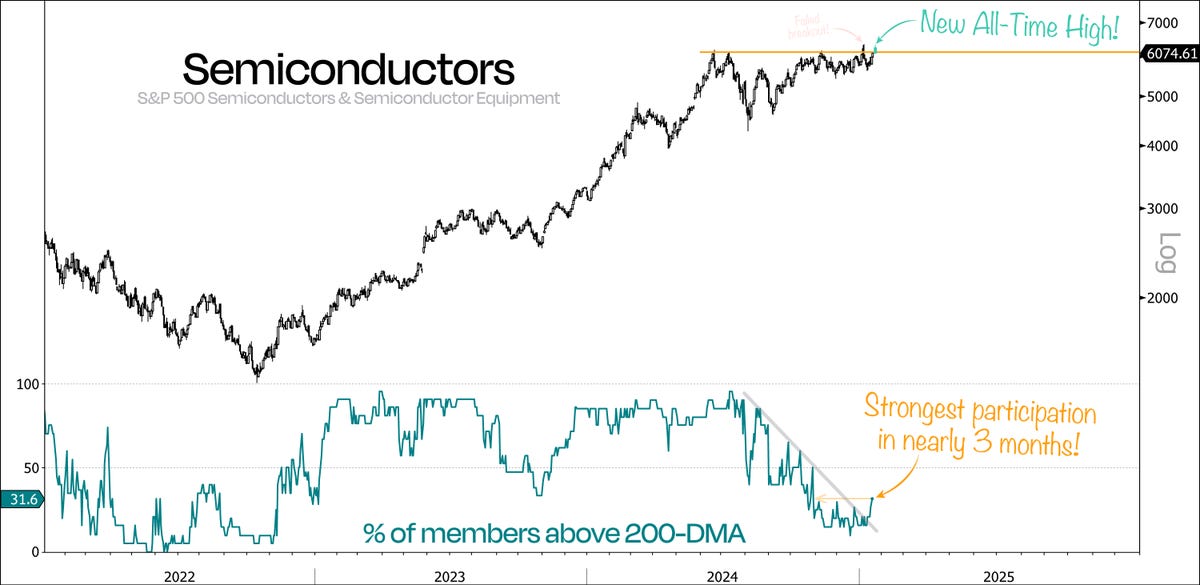
Source: @DualityResearch Duality Research via @TheChartReport
3. Semiconductors Market Cap Weight: And speaking of excesses…
Maybe that is the new normal, maybe it’s an echo of 2000 (maybe a bit of both).

Source: Topdown Charts
4. Magnificent Corporate Bonds: There is an apparent belief among bond market participants that Apple/Microsoft are as good as the US government in terms of willingness and ability to make good on debt payments. With the way the US fiscal situation has been going, maybe they have a point, but also it goes to show how complacent sentiment is on big tech and credit in general.
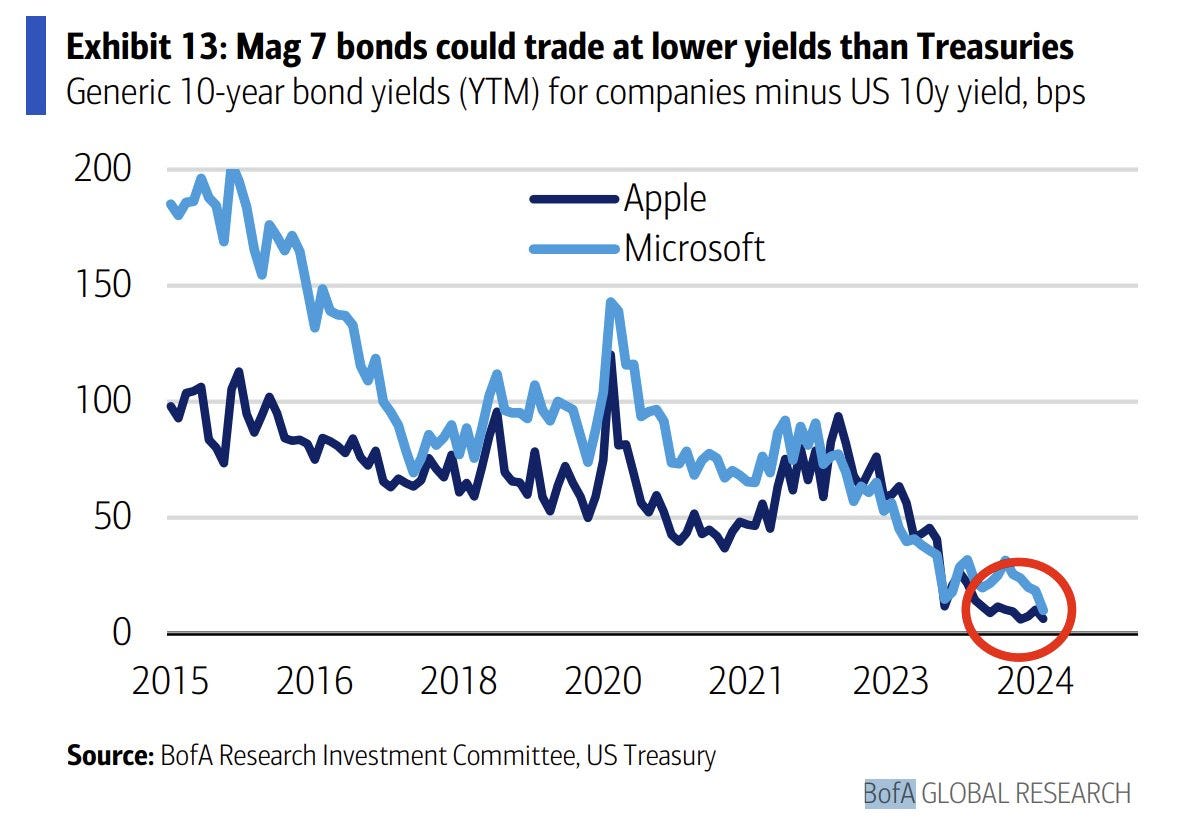
Source: Andrew Sarna
5. Credit Risk Premium: It’s not just big tech — complacency is *the* vibe of the market right now. High yield corporate bond spreads are back to 2007 levels, and the equity risk premium is closing in on multi-decade lows.
No risk premium, no problem it seems.

Source: Topdown Charts Professional
6. Credit vs Equity Valuations: Flipping things on the credit side, the other way to look at it is both equity and credit markets are extreme expensive, overvalued, and at risk should we run into any macro turbulence.

Source: ChartStorm Perspectives Pack
7. Unanimously Expensive: And here’s another angle on it, this one shows what looks to be the average historical percentile ranking across 8 different valuation metrics, and the signal is unanimous: the US stockmarket has reached new heights of valuation extremes. You can kind of explain away some of this with datapoints of how valuations don’t matter in the short-run, or that it’s expensive for good reason, etc, but I think it’s quite dangerous to try and argue that valuations don’t matter when we’re at this stage of the cycle (and it might even be outright irresponsible).
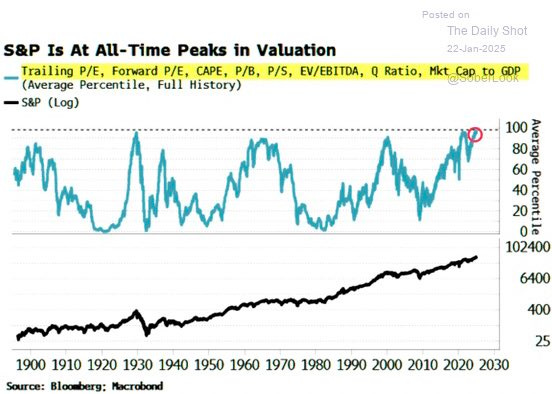
Source: @joosteninvestor via DailyShot
8. Weighting-Up Global Equity Valuations: Aside from being expensive vs history, US equities are expensive vs global stocks, but as the analysis below shows — on a comparable sector weighting basis, the valuation gap remains but shrinks somewhat.

Source: @michaelbatnick via @dailychartbook
9. A Recession in Recessions: Over time something has happened to the US economy that’s made the frequency and duration of recessions reduce… to the point that the 2010’s were the first decade featuring no recession or bear market (and bear markets are basically caused most of the time by recession). I would say improved macroeconomic policy is a key part of this, but also globalization effects, and changing composition of the US economy (services tend to be less cyclical than manufacturing) — all good things. But I think it would be wrong and dangerous to assert that we are ""post-cycle"" and that a recession or downturn will never happen again.

Source: @awealthofcs
10. Analyst Attention: The biggest stocks get the most analyst attention. Interestingly, 73 analysts cover AMZN, 72 META, and 66 NVDA — you’d think these companies are well enough understood that they wouldn’t need that many people covering them… and if anything investors might benefit more from smaller stocks getting greater coverage. I guess it’s also a sentiment sign, and ultimately a reflection of market demand.
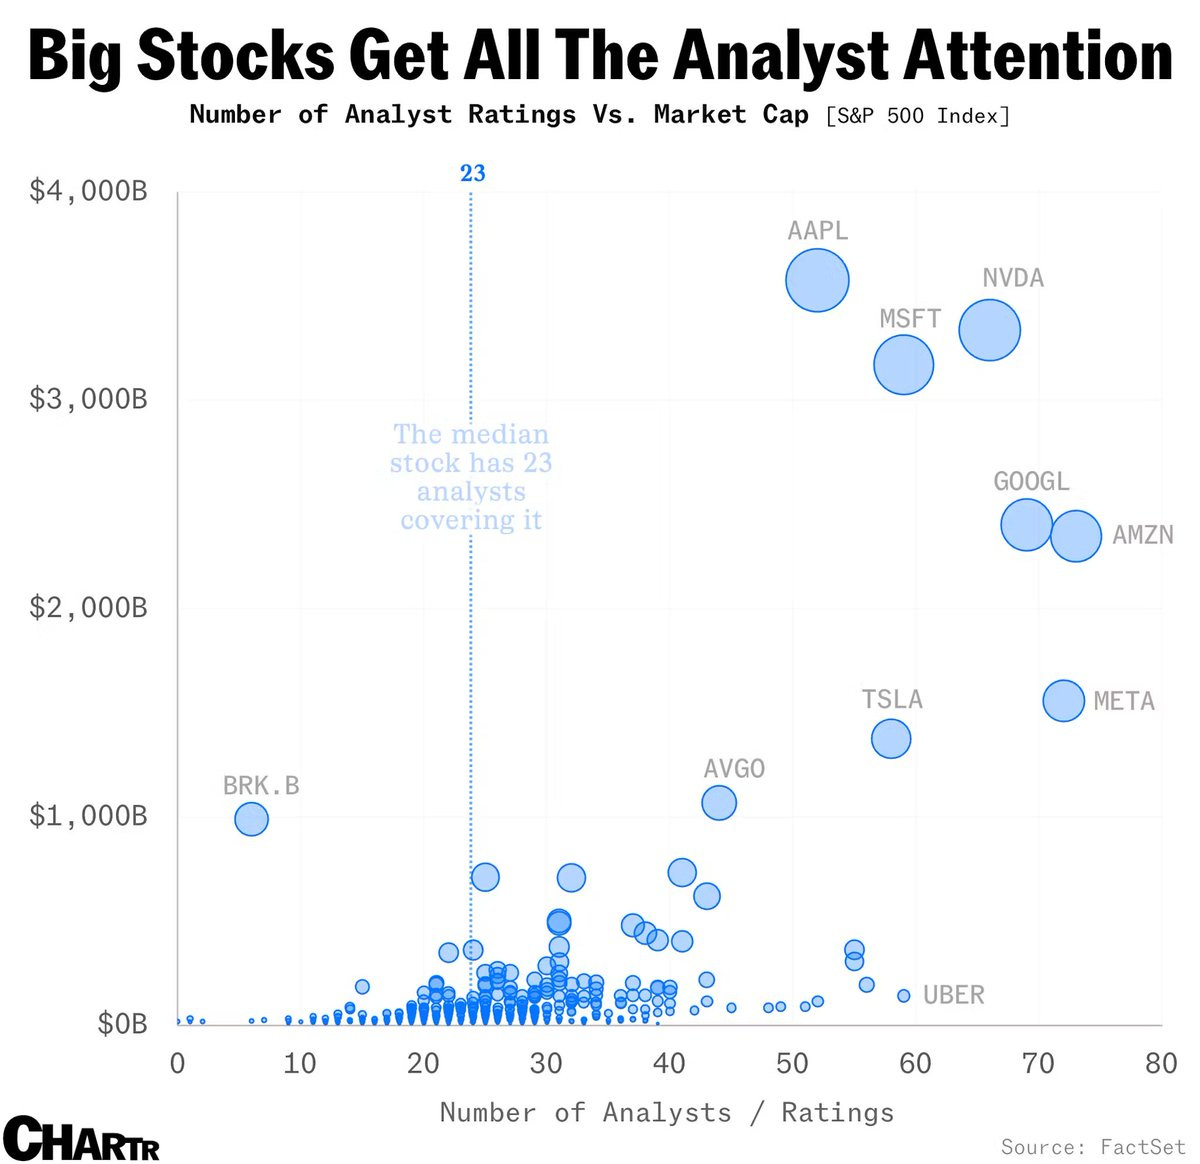
Source: @chartrdaily
Thanks for reading, I appreciate your support! Please feel welcome to share this with friends and colleagues — referrals are most welcome :-)
BONUS CHART >> got to include a goody for the goodies who subscribed.
Super Sector Skews: The funny thing about this chart (from the just updated Perspectives Pack) is there seems to be a repeating and reliable pattern —a procession of sector bubbles…

It was traditional cyclicals in the late-70s (energy), defensives in the early-90’s (healthcare/biotech), tech in the late-90’s (dot com bubble), traditional cyclicals again in the 2000’s (financials + commodities), and now tech again. [super sector definitions]
History and global markets show that you can get structural shifts in market composition (vs just cyclical/boom/bubble moves), and I would say a big chunk of the move up in in recent years tech is structural… but you can also get a bit of both. And I would say the current regime is a combination of frothy/bubbly cyclical uplift in tech, and structural change in the market.
The other point to note is for passive index investors, their portfolio is fairly all-in on tech, and much less defensive than usual at this point — not a good recipe for success should tech come undone.
—
Best regards,
Callum Thomas
Looking for further insights? Check out my work at Topdown Charts
Hi Callum, excellent charts. I am a subscriber since a year and got a message from substack (you?) that my creditcard was denied. I have sent an email, as it should work now. But the email-adress of substack was a "no reply". Could you pls let me know, which email address I could use to inform about my creditcard? I would like to continue my subscription. Many thanks.
Callum - please remind me of the best way to forward today's letter to a friend?