
Weekly S&P500 ChartStorm - 25 June 2023
This week: stock market technicals, bear market rallies, AI hype, breadth, valuations, seasons and cycles, VIX warnings, balance sheet imbalances, and freight recession...

Welcome to the latest Weekly S&P500 #ChartStorm!
Learnings and conclusions from this week’s charts:
Zooming out, the rally off the October lows looks solid, and has crushed previous bear market rally records (which means it’s probably not a bear market rally).
Zooming back in though it looks like most of the upside this year is down to AI hype (and the rest of the market still looks bearish — or at best a range-trade).
There is a wide valuation gap between big tech vs the rest of the S&P500.
VIX futures spreads, central bank liquidity, and domestic freight rates are among the indicators cautioning near-term downside risk for the stockmarket.
The VIX and the S&P500 are sticking to their seasonal script, which has meant tailwinds in H1 (and seasonal headwinds into Q3).
Overall, on this week’s charts its basically a picture of smooth sailing on the surface, some turbulence in the waters below, and rough waters ahead.
1. Onwards & Upwards: In this chart Mark highlights how “the run-up since Oct 2022 has featured classic breadth thrust, breadth recovery, and price momentum, suggesting a cyclical advance toward SPX 5400-5600”. It's an interesting observation and probably a minority perspective in terms of the scenario/targets suggested.

Source: @mark_ungewitter
2. Long in the Tooth: If this is still a bear market rally it will end up being the longest bear market rally in history (which probably means it isn’t a bear market rally!).
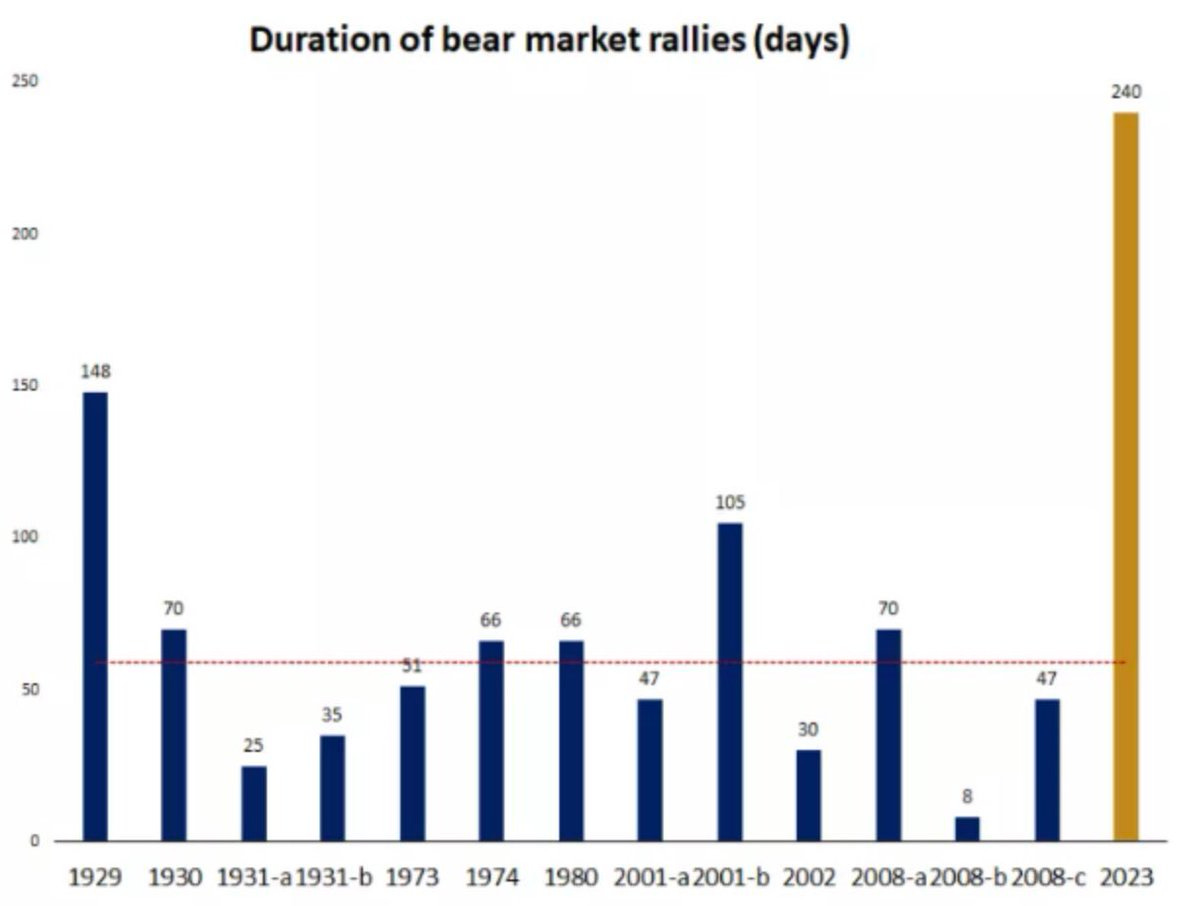
Source: @joosteninvestor
3. High in Gains: If this is a bear market rally, it will also be the most substantial bear market rally *in terms of retracement of preceding decline* on record. Again, probably another sign that it is not a bear market rally. But that’s not to say there is no chance of a bear market... You could easily get a situation where you have what some might call a short-sharp bull market, followed by a new bear market.
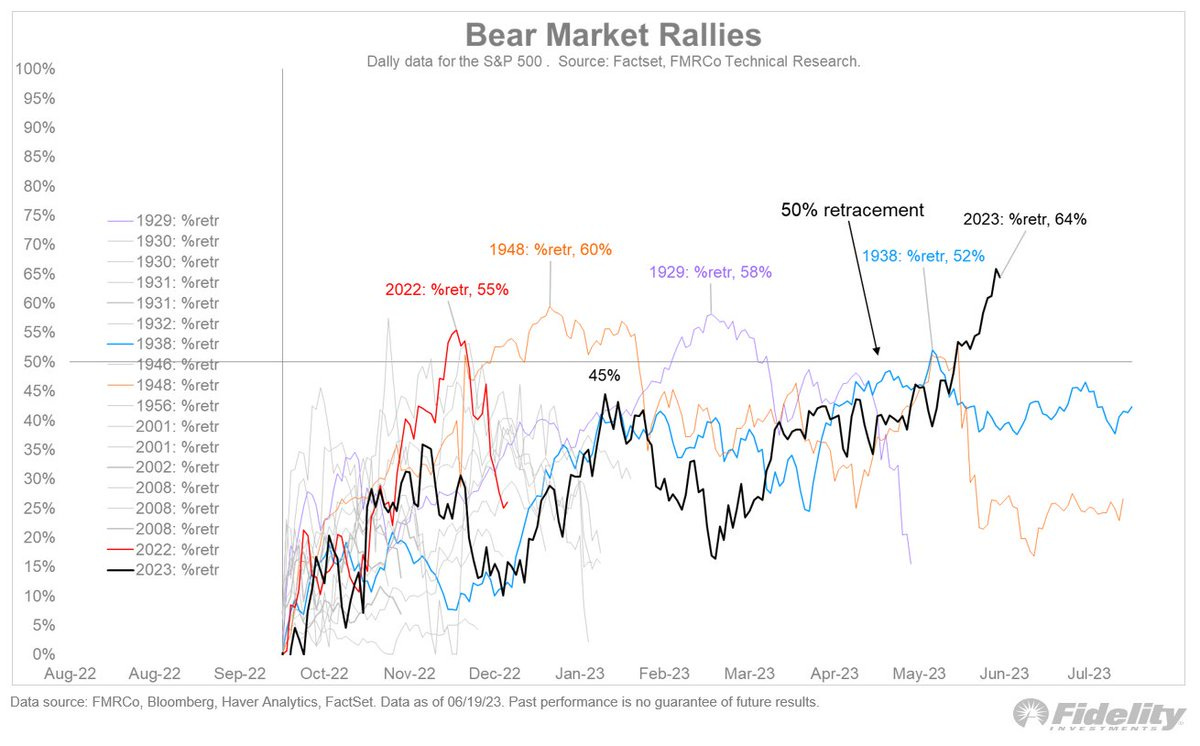
Source: @TimmerFidelity
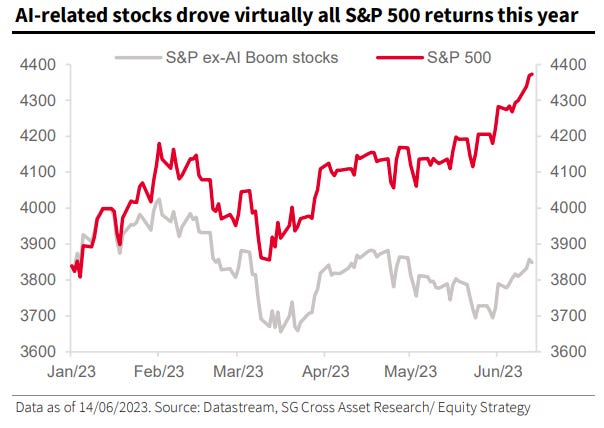
4. All Just AI Hype? If we look at the S&P500 excluding the AI Boom stocks, it looks much less gainy, on first glance on this window of time it does not look at all like a bull market, at the very best maybe a “crab market” that moves in a sideways range-trade.
Source: @TheIdeaFarm @johnauthers
5. Equal-Weighted Evenly-Balanced: Indeed, looking at the equal-weighted version of the S&P500, it’s a wash, no new lows since October, but basically a sideways moving range trade since early-2022 (and well, basically going no where since mid-2021). And since the Oct/Nov rebound, market breadth for the S&P500 has likewise been drifting between average and mediocre (much like my high school grades).

Source: MarketCharts
6. Relative Value? Depending on your perspective, you might say big tech is stretched expensive, or you might say the rest of the S&P500 is cheap on a relative basis, and hence has catch-up potential.
