Weekly S&P500 ChartStorm - 24 Mar 2024
This week: bulls and bears, consensus sentiment, small speculators, large investors, tech supreme, valuations, earnings expectations, startup shutdowns, volatility...
Welcome to the latest Weekly S&P500 #ChartStorm!
Learnings and conclusions from this week’s charts:
Sentiment is increasingly consensus bullish.
Bears have all but gone extinct.
Large and small investors alike are basically all-in.
Tech stock valuations have surpassed the 2021 peak.
Downside volatility has collapsed (typical in bull markets).
Overall, the evidence is all consistent with what you typically see during a bull market; sentiment is bullish, investors are on the bandwagon, earnings expectations are running high, valuations show unbridled optimism, downside volatility is in a state of soothing calm. These are the types of dynamics that can form self-reinforcing feedback loops launching into bubble-like conditions. But in this strength is also a form of fragility — if a reason ever rises to doubt the bull case, there are a lot of minds that could change.
1. Bulls and Bears: This pair of charts shows the path of bulls and bears in the AAII and II surveys (longest running sentiment surveys) — they show at once, how the current cyclical bull market emerged (from the previous collapse in bullishness and surge to rare heights in bearishness)… but also the current state of things: despite a vocal minority, most people are bullish, and bears are gone.
Source: Topdown Charts Topdown Charts Professional
2. Consensus Bulls: The Consensus Inc. Bullish Sentiment Index — known by practitioners as “Consensus Bulls”, pretty much says it all in that name. Almost 80% of market analysts surveyed by Consensus Inc. are bullish.
Source: Himount Research Willie Delwiche, CMT, CFA
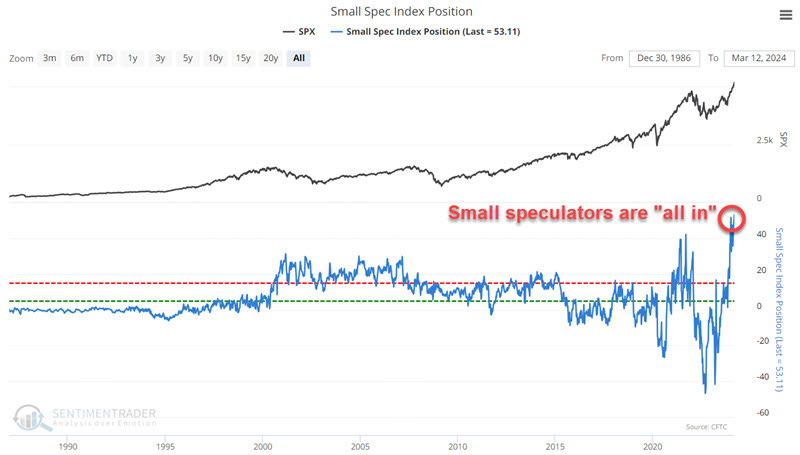
3. Small Big Bulls: Small speculators in stock index futures have reached their most bullish net position ever. Consistent with the previous survey charts.
Source: @sentimentrader
4. Big Money Big Bulls: Larger investors are also going with the bullish flow — BofA Fund Manager survey shows allocations to US equities is now at the highest level since Nov 2021.
Source: @GameofTrades_
5. Tech Supreme: Tech stocks have broken out to an all-time high relative to the S&P 500 — not to jinx it, but that looks like the establishment of a new permanently higher plateau for tech stocks!
Source: Daily Chartbook
6. Tech Value: US tech stock valuations have now surpassed the 2021 highs in both absolute terms (vs their own history) and relative terms (vs the rest of the market).
Source: 12 Charts to Watch in 2024 [Q1 Update]
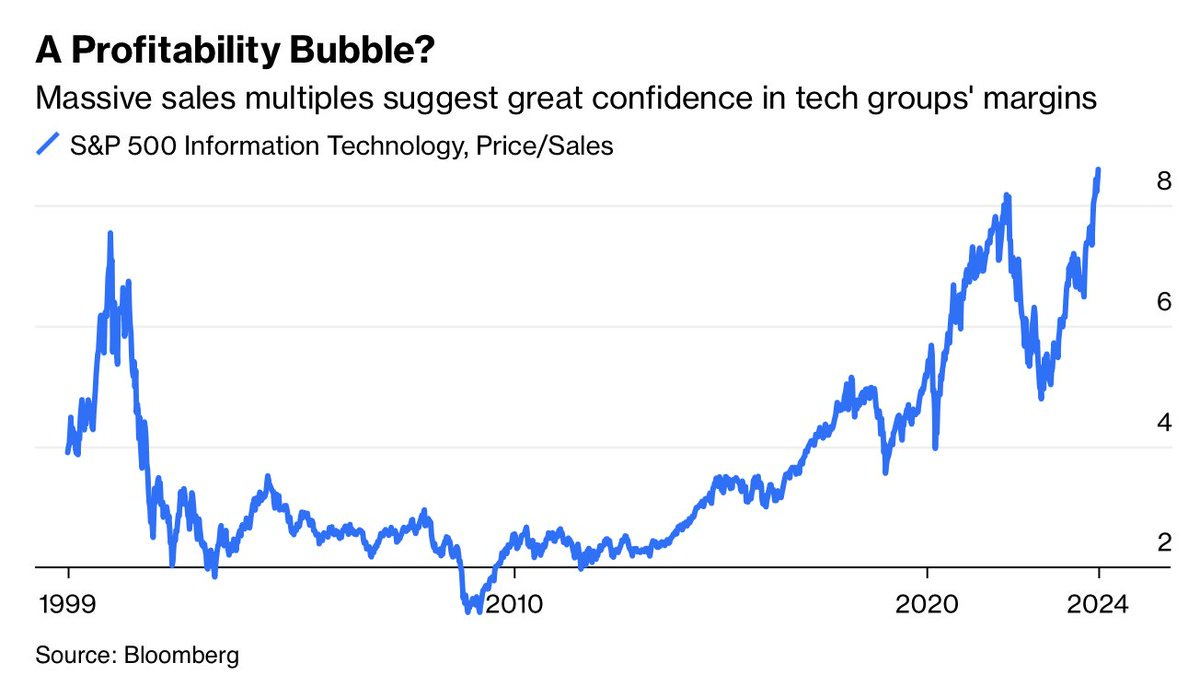
7. Highly Valuable Sales: Investors are happy to pay a premium for sales because of elevated profit margins, and because of narratives and perceptions that sales will surge higher evermore.
Source: @jessefelder @johnauthers
8. Earnings Growth Enthusiasm: Another angle on that — long-term earnings growth forecasts are surging once again as the AI era emerges.
Source: Topdown Charts Topdown Charts Professional
9. Startup Shutdown: I thought this data point interesting alongside the tech ebullience, the numbers are not huge, and maybe more of a symptom of the excesses of 2020/21 (where cheap and freely available capital probably went to places it might arguably shouldn’t have). But still, an interesting trend, and at odds with the optimism on display in sentiment and valuations.


