
Weekly S&P500 ChartStorm - 23 January 2022
This week: check on technicals, risk levels, correction drivers, sentiment shifts, plenty to think about on the near-term outlook...

Welcome to the Weekly S&P500 #ChartStorm (by email!)
The Chart Storm is a weekly selection of 10 charts which I hand pick from around the web, and then post on Twitter.
The charts focus on the S&P500 (US equities); and the various forces and factors that influence the outlook — with the aim of bringing insight and perspective.
Hope you enjoy!
p.s. if you haven’t already, subscribe (free) to receive the ChartStorm direct to your inbox, so you don’t miss out on any charts (you never know which one could change your whole perspective!)
***ALSO: in case you missed it, check out my (Topdown Charts) 2021 End of Year Special Report (includes 50 of my best, worst, and favorite macro/market charts of 2021 + the must-see macro/market charts to have on your radar in 2022…)
1. SitRep: The 200dma = invaded. The 4400 level = minor incursion. But bigger picture, 4300 = the red line. The market probably remains under pressure this week with geopolitics front of mind, and the January Fed meeting (to sum up the fears - some folk have (wrongly) been floating the idea of a 50bp hike… something that seems unlikely given how risk-averse the Fed has been this cycle). Given a lot of this correction has to do with repricing risks, we could easily see a relief rally post-Fed.
Source: @Callum_Thomas
2. Red Lines: Another red line is the percentage of S&P500 stocks above their 200-day moving average. Currently it is sitting at basically 50/50 (which actually speaks a lot to the violent rotations underway under the surface). So watch this one closely: a break below 50% on this breadth indicator will be a major risk red flag.

Source: @Callum_Thomas
3. Bing Bong! Nasdaq 200dma breadth on the other hand is in free-fall as the previously popular hot growth/tech stocks correct from frothy levels.

Source: @Callum_Thomas
4. Reasons 1/3 — Inflation & the Fed: A key part of the correction has basically been a combination of surging inflation (and inflation expectations), along with the market waking up to the Fed policy pivot: "don't fight the Fed" means go with the flow when the Fed is easing vs tightening, and they have resolutely shifted into a tightening bias this year… i.e. the Fed no longer got your back.
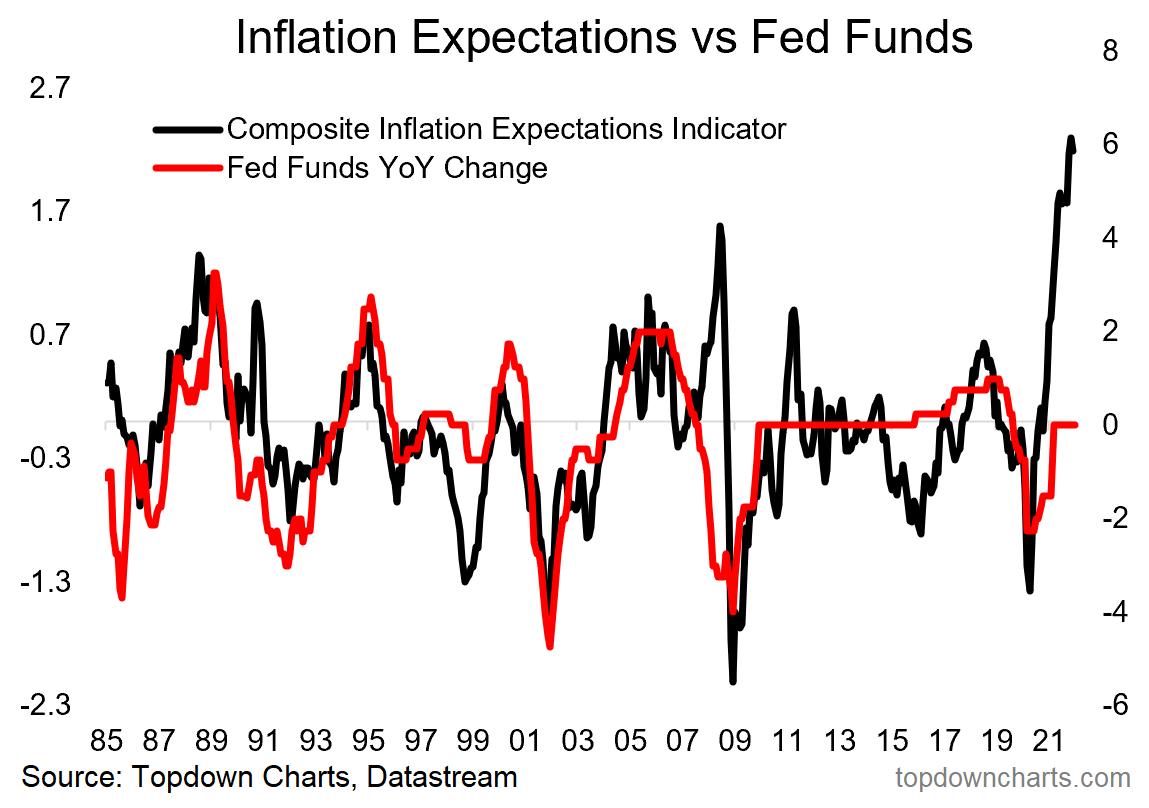
Source: @topdowncharts
5. Reasons 2/3 — Geopolitical Risk: Another element rattling markets is basically the market finally waking up to geopolitical risk. The Russia/Ukraine situation has been simmering away in the background, but the last couple of weeks it has become more widely understood (into the mainstream) — thus is now is a known unknown.

Source: @topdowncharts
6. Reasons 3/3 — Stretched Valuations: Valuations don't matter 'til they do.
It's been widely documented that US equities look very expensive -- with some pushback given low yields (at least for now - but that thesis has been rattled by the jump in bond yields we’ve seen this year).
As of Friday valuations are down, but not cheap. Not even close.

Source: @topdowncharts
7. Baltic Dry: Curiously, while the Harpex & China Containerized Freight Indexes show general shipping costs still at record highs, the Baltic Dry Index — which by contrast focuses more on the rates for shipping commodities — has dropped-off significantly. Part of this is down to simply working through backlogs, but part of it also reflects a drop in demand e.g. China property market downturn has reduced demand for iron ore (but also Chinese New Year seasonality effects). Of concern is an apparent tendency for it to lead stocks (down).

Source: @alphacharts
8. Sentiment Check - IMI: As a Sentiment Check, the IHS Markit Investment Manager Index dropped significantly in January, but of most interest in that report is this chart which shows the breakdown of sentiment across market drivers...
Disappointment on fiscal policy + the Powell policy pivot are clear downside drivers (and relatedly, the political environment).
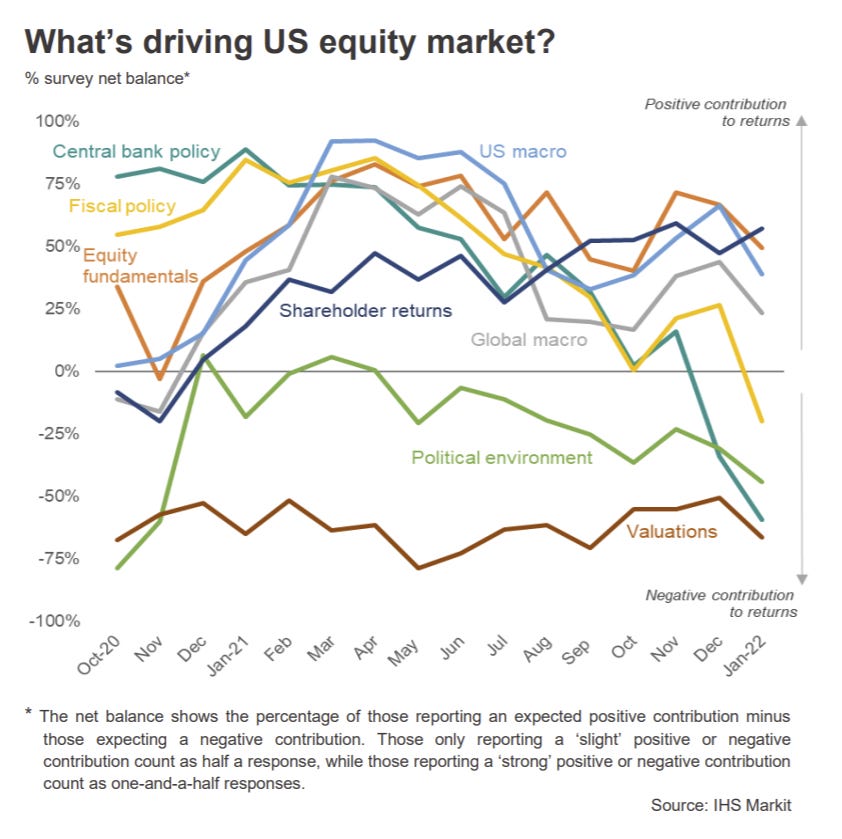
Source: @IHSMarkitPMI
9. Nasdaq Sentiment: Shockingly, “Nasdaq investor sentiment is worse now than it was in MARCH 2020." This clearly raises the odds of a short-term bounce, but I would caution that a lot of this correction has been about correcting excessive valuations and adjusting to shifting macro.

Source: @MacroCharts
10. Great Rotation: A great rotation has already been underway for several years - out of old energy and financials and into tech. Big rotations like this can get unwound quickly/disruptively, certainly something to be mindful of.
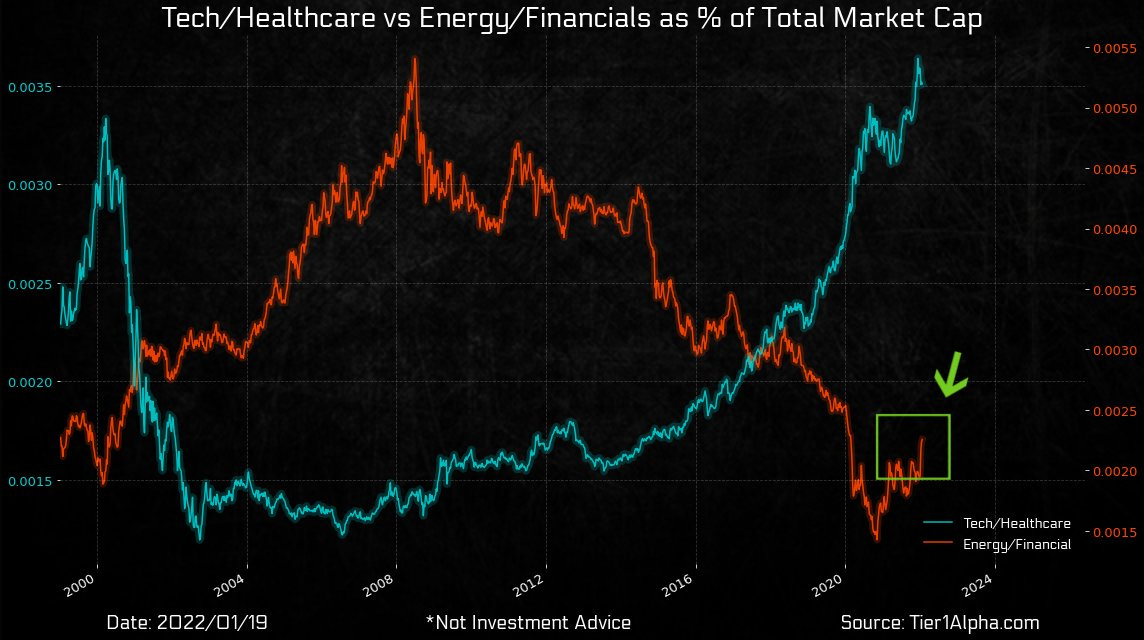
Source: @t1alpha
Thanks for following, I appreciate your interest!
oh… that’s right, almost forgot!
BONUS CHART >> got to include a goody for the goodies who subscribed.
Sentiment Shifts: stock market sentiment has plunged to panic levels.
This chart shows the combined bulls vs bears signal from the AAII and II surveys. It shows a sharp extension of the recent trend towards the bearish side (from the peak in bullishness back in early 2021).

What I find most interesting about this chart is how deep the bearishness is compared to the move in price. Previous episodes where sentiment got this bearish came off the back of much sharper/larger drawdowns.
Given that the market is adjusting to shifting macro circumstances from a starting point of high valuations it is a risky situation.
That said, as noted previously, the odds of a bounce increase as sentiment drops to extremes like this.
Stay nimble, stay safe, and keep watching the charts…
—
Best regards,
Callum Thomas
»» SPONSOR: ( …he’s me!)
My research firm, Topdown Charts, has a new entry-level Substack service, which is designed to distill some of the key ideas and themes from the institutional fund manager service to provide the same high quality insights at a more accessible price.
Give it a try and let me know what you think :-)