

Welcome to the latest Weekly S&P500 #ChartStorm!
Learnings and conclusions from this week’s charts:
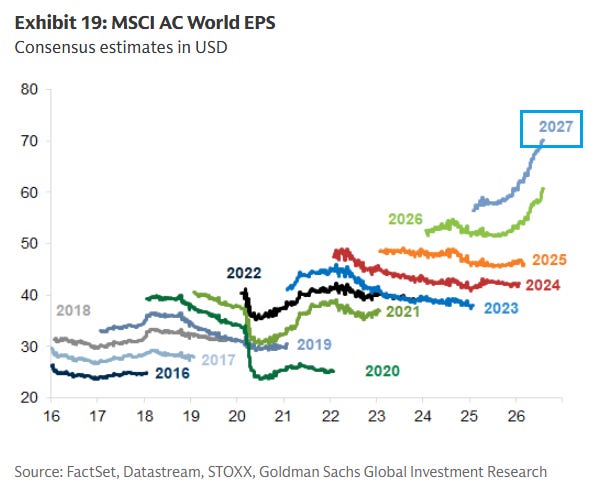
Global corporate earnings estimates are surging.
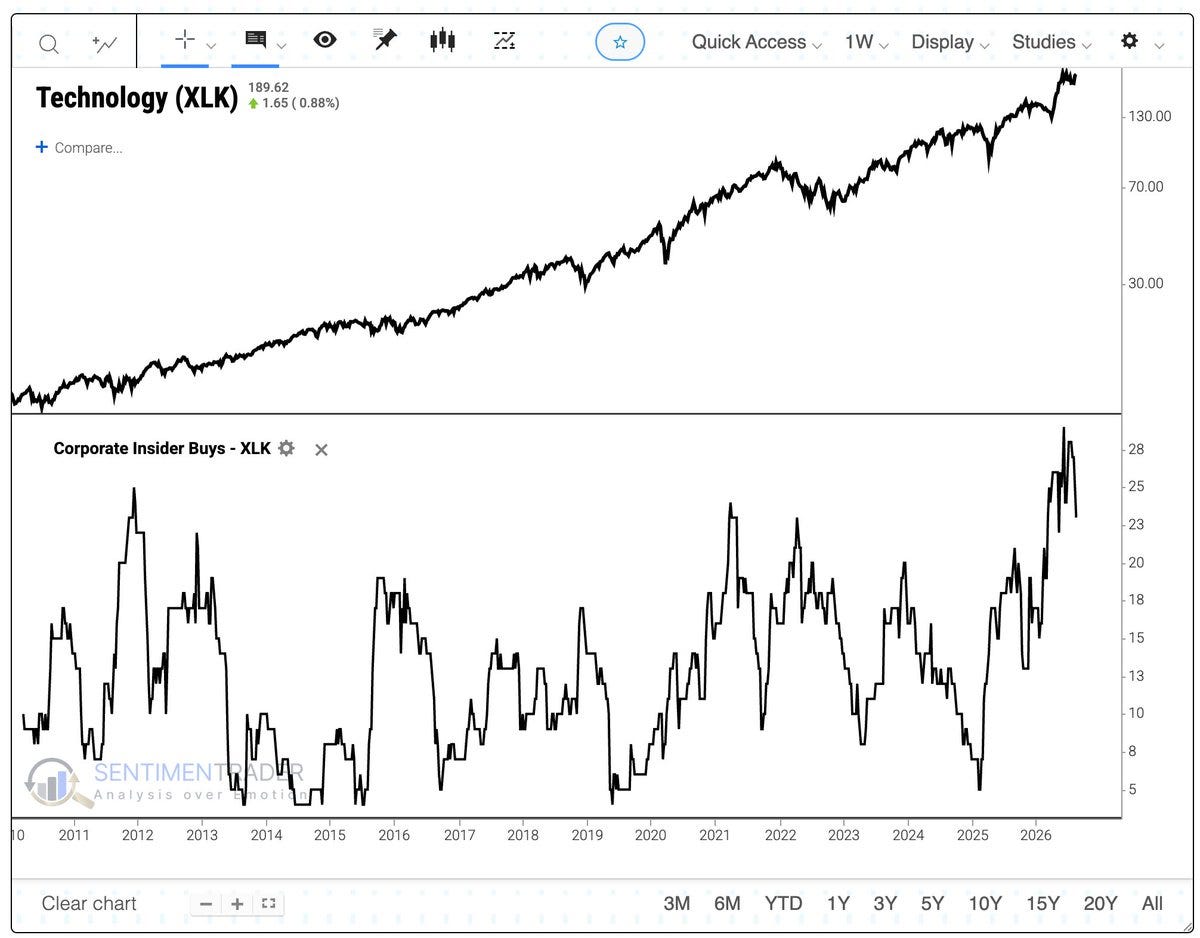
Tech is seeing big insider buying (but also heavy shorting).
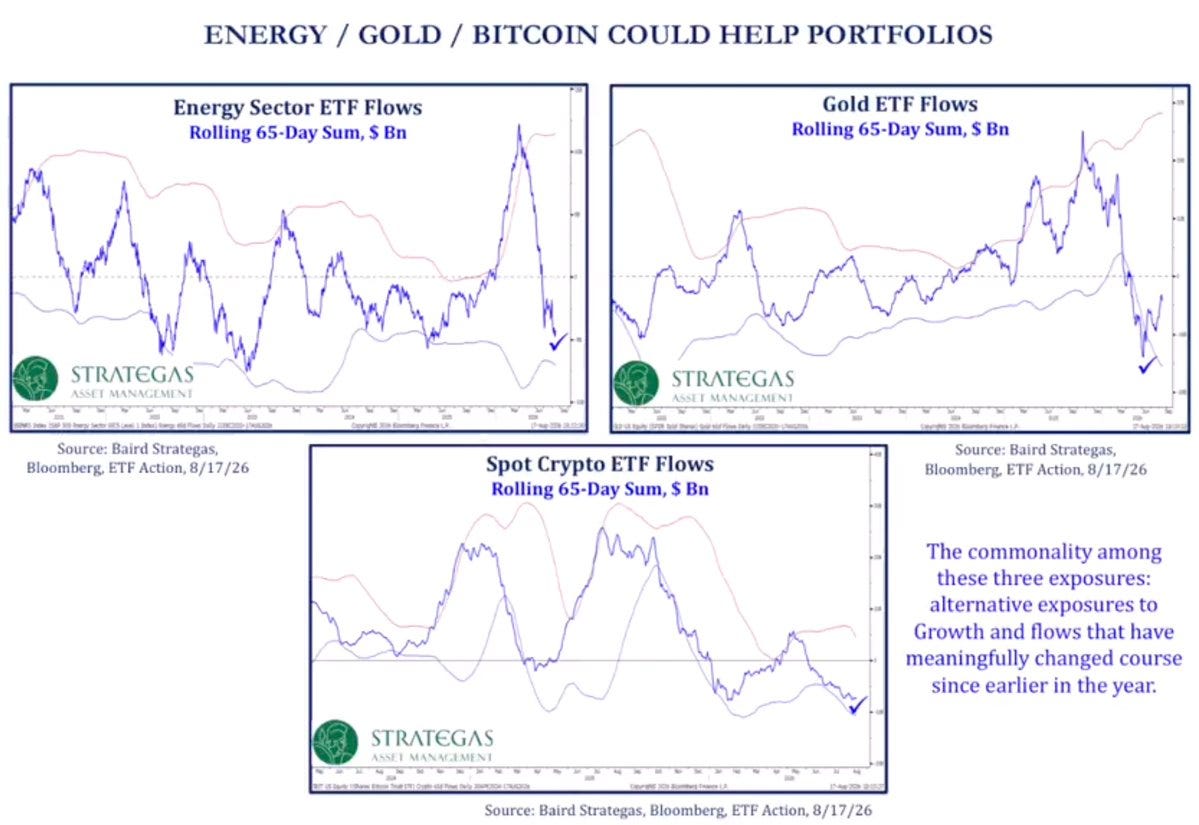
Energy, Gold, Bitcoin seen major ETF outflows (+are all turning up again).
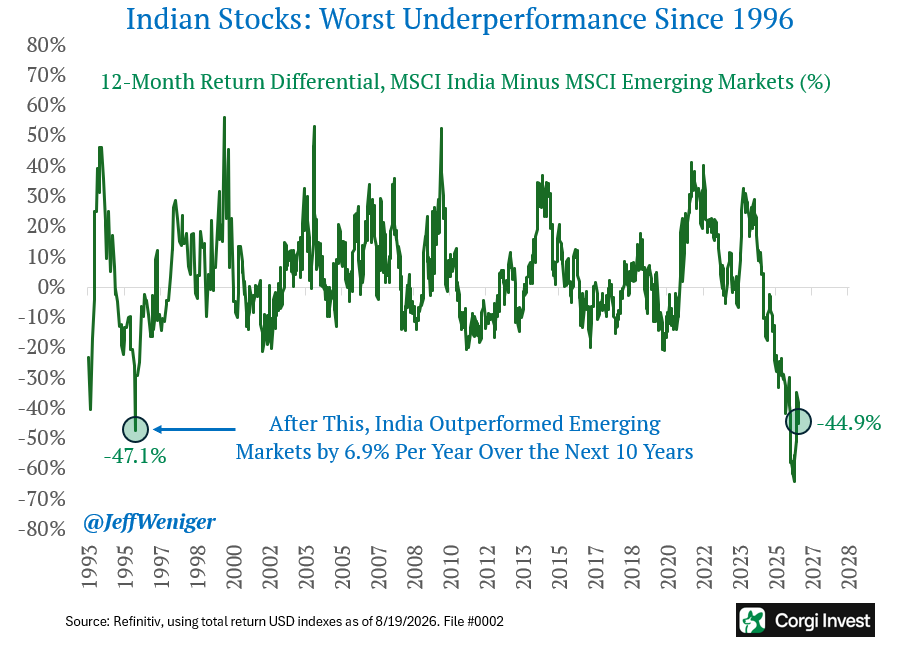
Indian stocks have been punished as an AI-loser within emerging markets.
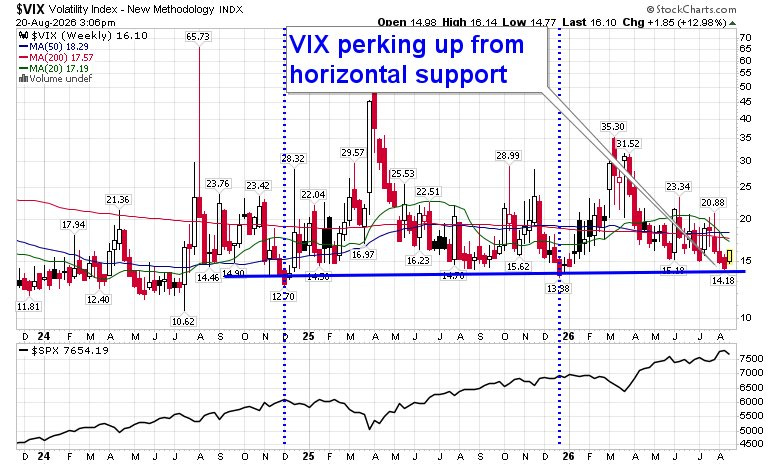
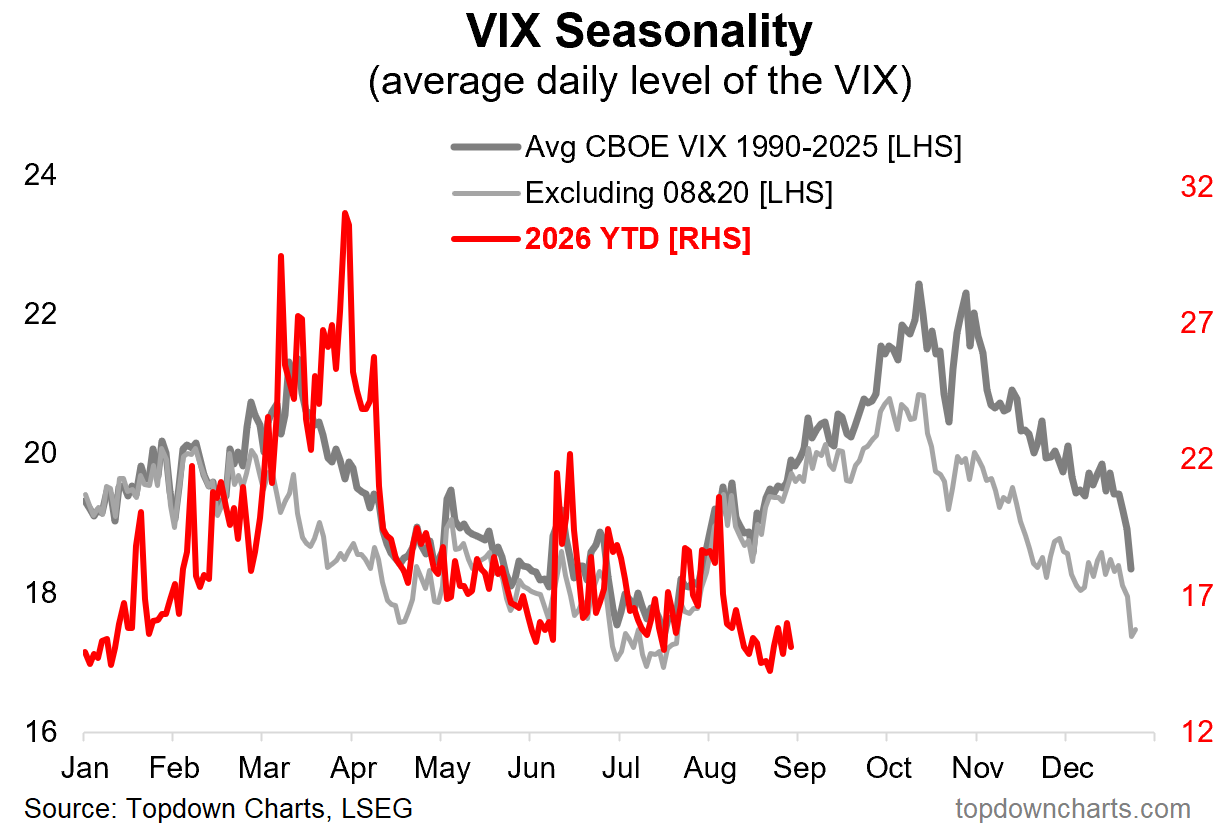
The VIX is bouncing along the bottom of the range, seasonality says it goes up.
Overall, the global equities bull market looks alive and well, especially when you consider the surge in earnings expectations underpinning it. US tech stocks meanwhile are seeing mixed signals as a 3-month stall sets in. And on the risk front, volatility is lurking in the shadows, with seasonality suggesting spikes in the VIX (aka risks remain).
1. Global Earnings Outlook: starting global this week, similar to the trajectory of US earnings (which I highlight last week); global earnings are bucking their usual trend of sideways-to-downward movement through the year — 2026/27 EPS estimates for the MSCI All Countries World index are surging.
Source: @MikeZaccardi
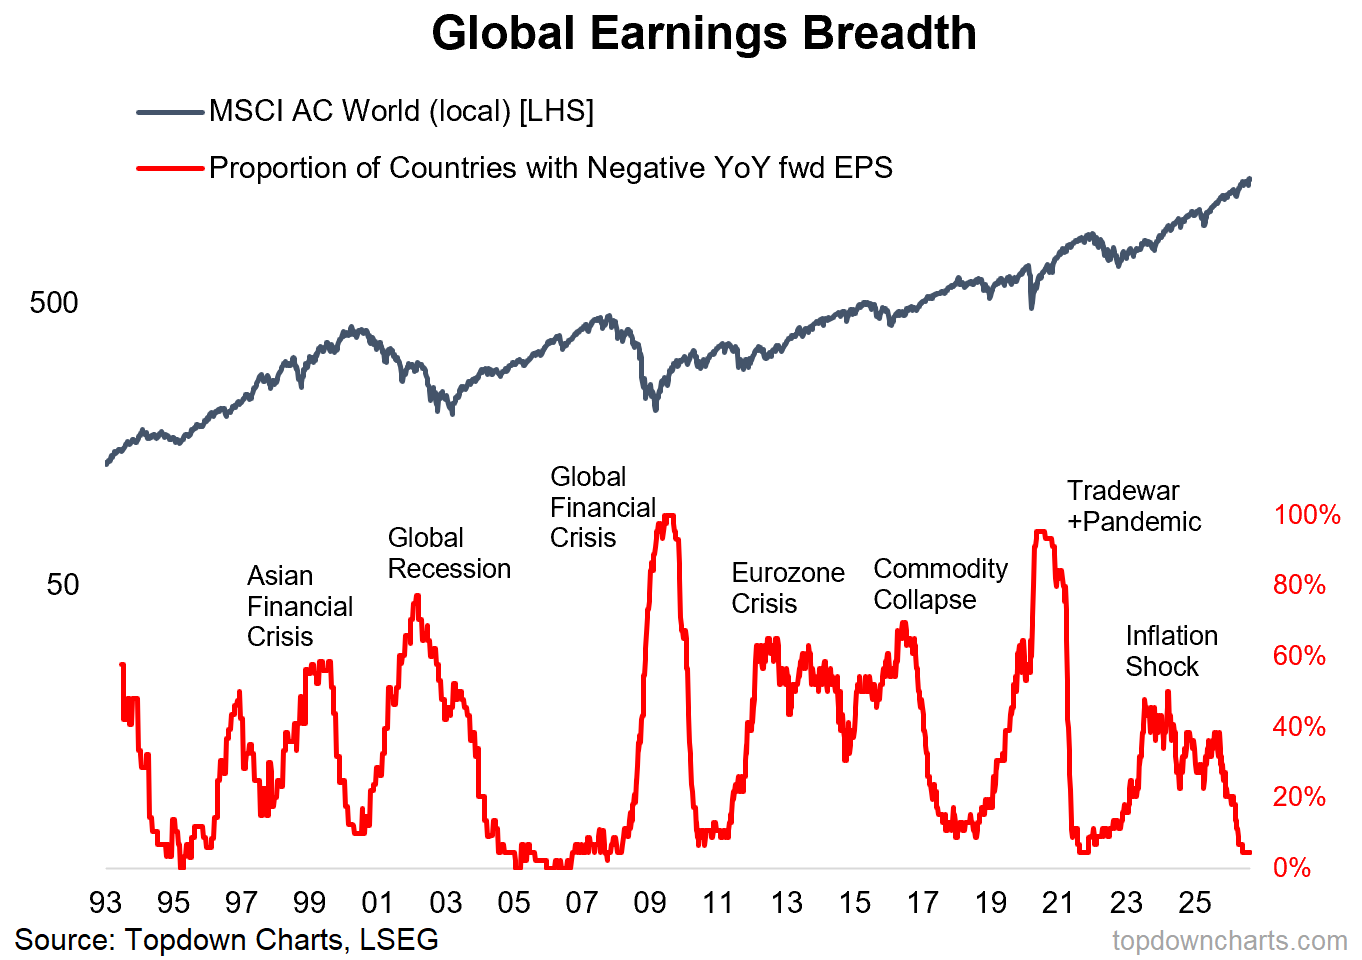
2. Global Equity Bull Market: on a similar note, the breadth of earnings globally looks good too —the proportion of countries seeing earnings downgraded (negative forward EPS on a YoY basis) have dropped to cycle lows.
This is a sign of strength and is helping reinforce the global equity bull market… but I would note that there is an element of “this is as good as it gets” (it can be a contrarian signal to see downgrade breadth drop towards zero and then turn up; but no sign of that as yet).
Source: Topdown Charts Professional
3. Tech Insider Buying: moving on, despite the global equity bull market, US tech stocks peaked back in early June and have been consolidating ever since. One sign that they might be gearing up to rejoin the global bull market though is the strong pace of corporate insider buying.
Source: @jasongoepfert
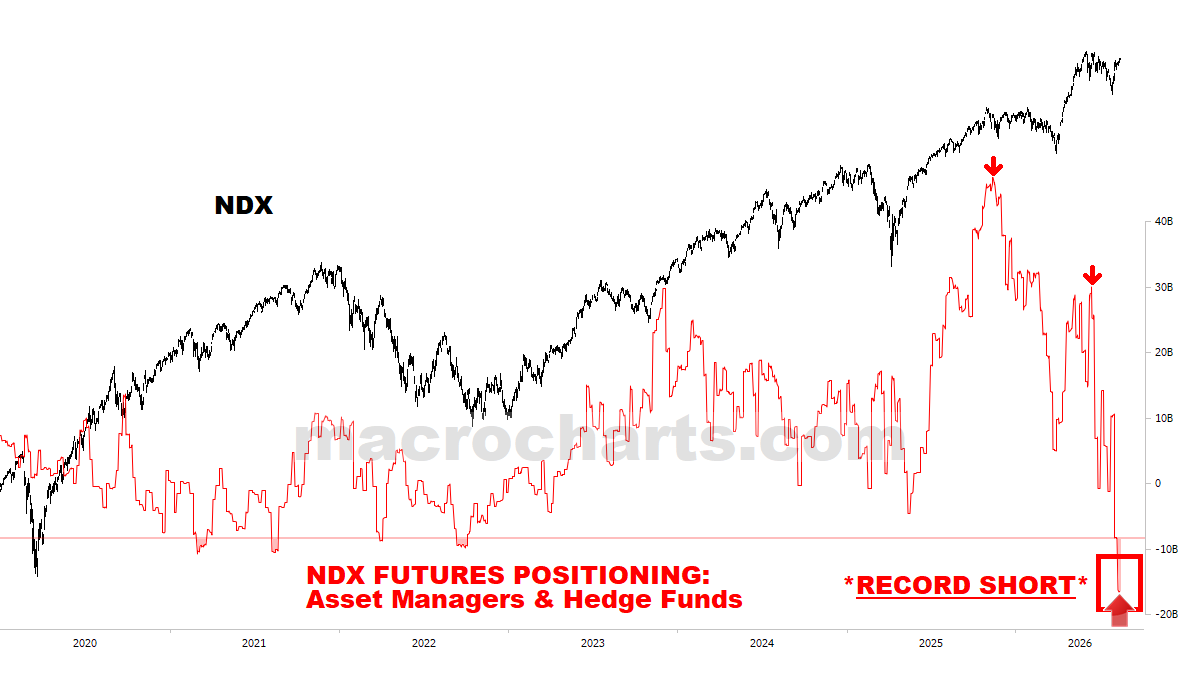
4. Nasdaq Big Shorts: that’s set against record short futures positioning by asset managers and hedge funds in the Nasdaq (smart money? or contrarian bullish signal?)
Source: @MacroCharts ( Macro Charts )
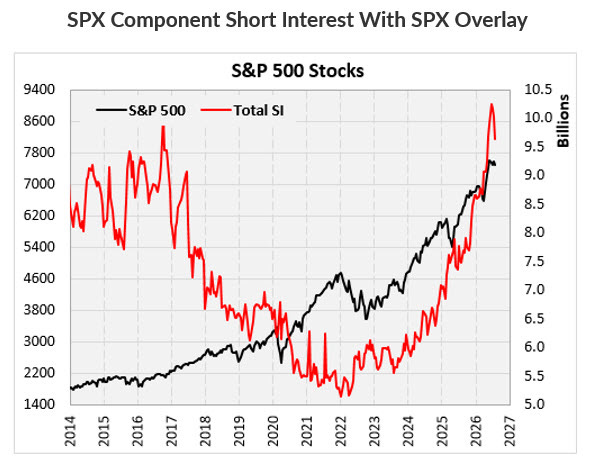
5. S&P500 Short Interest: similarly, Schaeffer’s points out the hefty total short interest across the S&P500 components, remarking: “That's a LOT of bearish positioning sitting underneath a bull market.. and potentially a lot of future buying power if shorts unwind.”
Source: @schaeffers
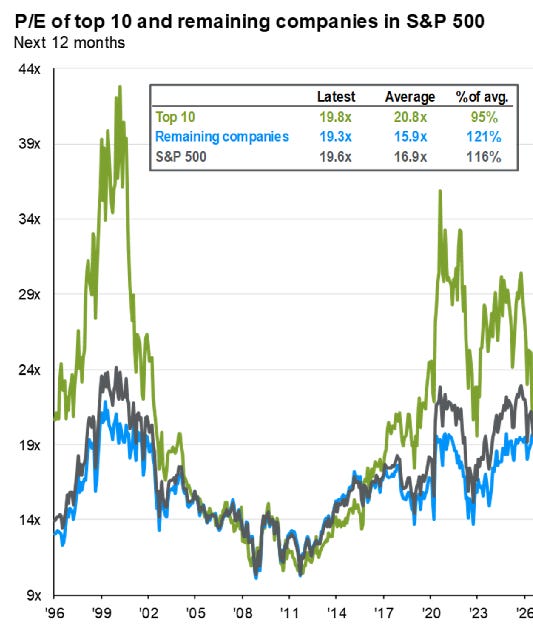
6. Forward PE Ratios: and then back on tech, the top 10 stocks’ forward PE ratio has dropped to the bottom end of the range of the past decade. It raises the question as to whether that’s a sign of a waning bull market, or a big reset bonus for bulls.
Source: @MikeZaccardi
7. Contrarian Corner — Energy, Gold, Bitcoin: energy, gold, and crypto have fallen out of favor for investors judging by ETF fund flows. And this comes at a time where all 3 of those are seeing prices turn up again.
It’s also a good juncture to ponder contrarian investing — there are two types of contrarian setups: 1. when a thing is out of favor but getting better and is actually good; 2. when a thing is out of favor and/because it is getting worse and is actually bad. Most of the time in markets, option 1 is more profitable.
Which is another way of saying, don’t be a contrarian just for the sake of being a contrarian, be a contrarian when it makes sense. It’s the old saying by AA Milne: “The third-rate mind is only happy when it is thinking with the majority. The second-rate mind is only happy when it is thinking with the minority. The first-rate mind is only happy when it is thinking.”
Source: @Todd_Sohn via @TheChartReport
8. Contrarian Corner — India vs Emerging Markets: another one for contrarians to ponder is India. As Jeff notes: “India's stock market has lagged emerging markets by 44.9%. That is the worst underperformance since 1996.”
And yup you guessed it, this is the AI trade. India is getting punished because consensus sees India’s outsourcing economy at risk of AI disruption… but also, the MSCI EM index is being boosted by Taiwan/Korea chip stocks. So this is basically a chart of perceived AI losers vs winners in emerging markets. The question would be, has it gone too far?
Source: @JeffWeniger
9. Volatility Floor: arguably this one might also be for the contrarians (given how bullish the stockmarket looks), the VIX is bouncing along the bottom of the range. The loose rule of thumb in markets is: low volatility is a good predictor of future higher volatility, and vice versa.
Source: @EquityClock
10. VIX Seasonal Script: seasonally speaking, we are right about due for a flare-up in volatility too. It’s anyone’s guess as to what might trigger it (if at all), but a few things come to mind: Fed (first rate hike incoming(?), Jackson Hole [this coming weekend!]), rising bond yields and inflation, (geo)politics (Middle East, Mid-terms, and Europe), or maybe even just something we can’t think of yet. The good news is that if we do get the fabled seasonal correction, seasonality turns positive into year end…
Source: Topdown Charts
Thanks for reading, I appreciate your support!
