Weekly S&P500 ChartStorm - 23 April 2023
This week: technicals check, earnings season, no new lows, VIX, sentiment, trend strength, debt ceiling default risk, financial conditions, liquidity pulse, earnings outlook, margin debt deleveraging
Welcome to the latest Weekly S&P500 #ChartStorm!
Learnings and conclusions from this week’s charts:
Bullish technical signs: price above (an upward sloping) 200-day moving average, falling VIX, no new lows within 6-months, sentiment improving but not excessive.
Bearish technical signs: 200-day moving average breadth making a lower high (within a falling wedge), trend strength fading, VIX “too low“?
Many macro catalysts incoming: 60%+ companies report earnings over the next 2 weeks, Fed likely hikes again in May, debt ceiling debate incoming.
Liquidity pulse has peaked and turned down (short-term downside risk).
Margin debt deleveraging pace has paused and turning back up now (a weak bullish signal, but with many nuances as explained below).
Overall, the situation of plenty of evidence for bulls and bears to make their case continues. But I would say, as noted below, the market looks ready for a short-term pullback, and there is ample macro catalysts looming as an excuse. Meantime, more ranging until we get either price and/or fundamental resolution…
Also, nice to see that The Weekly ChartStorm was named among the "20 Best Business and Investment Newsletters in 2023" :-)
1. Market Ups and Downs: I thought this one was interesting because on the bullish side the S&P500 is above its 200-day moving average AND the moving average is upward sloping (generally a good sign). But also interesting in that the index appears to be coiling into a triangle pattern …while breadth is making lower highs in a falling wedge. Wedges and triangles are interesting “trigger patterns” in that they lay out a clear trigger point e.g. a breakout of either line indicates the start of a new move. But also in that those lines set an interim floor and ceiling — the implication being that the index is due for a short-term pullback.
Source: MarketCharts @Callum_Thomas
2. Earnings Season Step-Up: Meanwhile, earnings season is about to really step-up (over 60% of the market reports over the next 2-weeks). If you are looking for some fundamental catalysts to trigger the next step in the chart above, this could be it (there’s also a bunch of economic data out next week e.g. Q1 GDP, house prices, consumer confidence, durable goods, BOJ).
Source: @Mayhem4Markets
3. Market Pathways: Back on the technicals, one interesting angle is shown here — how the market has traded after making a major low without making a new low within the subsequent 6 months (which the Oct 2022 low qualifies for). General drift upwards, with a couple of exceptions.
Source: @bespokeinvest via @RyanDetrick
4. Falling Volatility: Another interesting one is how the VIX has been pushing lower. If I look at my fundamental macro models for the VIX, it “should“ be higher, but if we look at price action (range-trading, relative quiet) then we can understand why it is ticking lower (best explainer for VIX levels is rolling 30-day historical volatility). But in terms of implications, a lower level and downward trend in the VIX is typically associated with bullish price action (bear markets typically see higher volatility, bull markets mostly see lower volatility — both economic volatility and price volatility!).
Source: @DKellerCMT
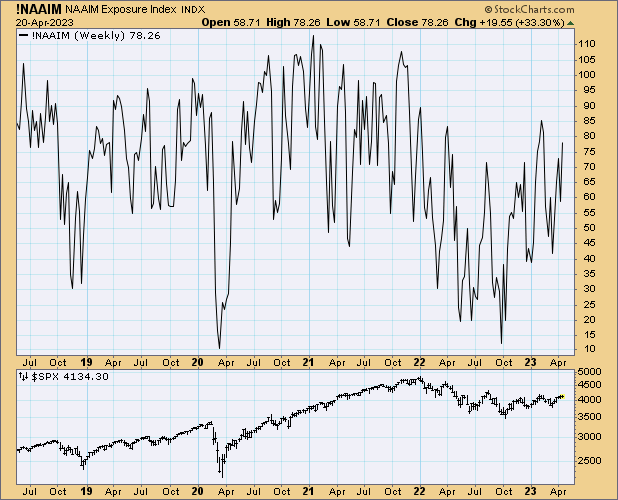
5. Investor Sentiment: Majority of respondents in the NAAIM survey are bullish, and are showing very clear eagerness to jump on board at the slightest bullish hint (nobody wants to get left behind if it is a new bull market!).
Source: @WalterDeemer
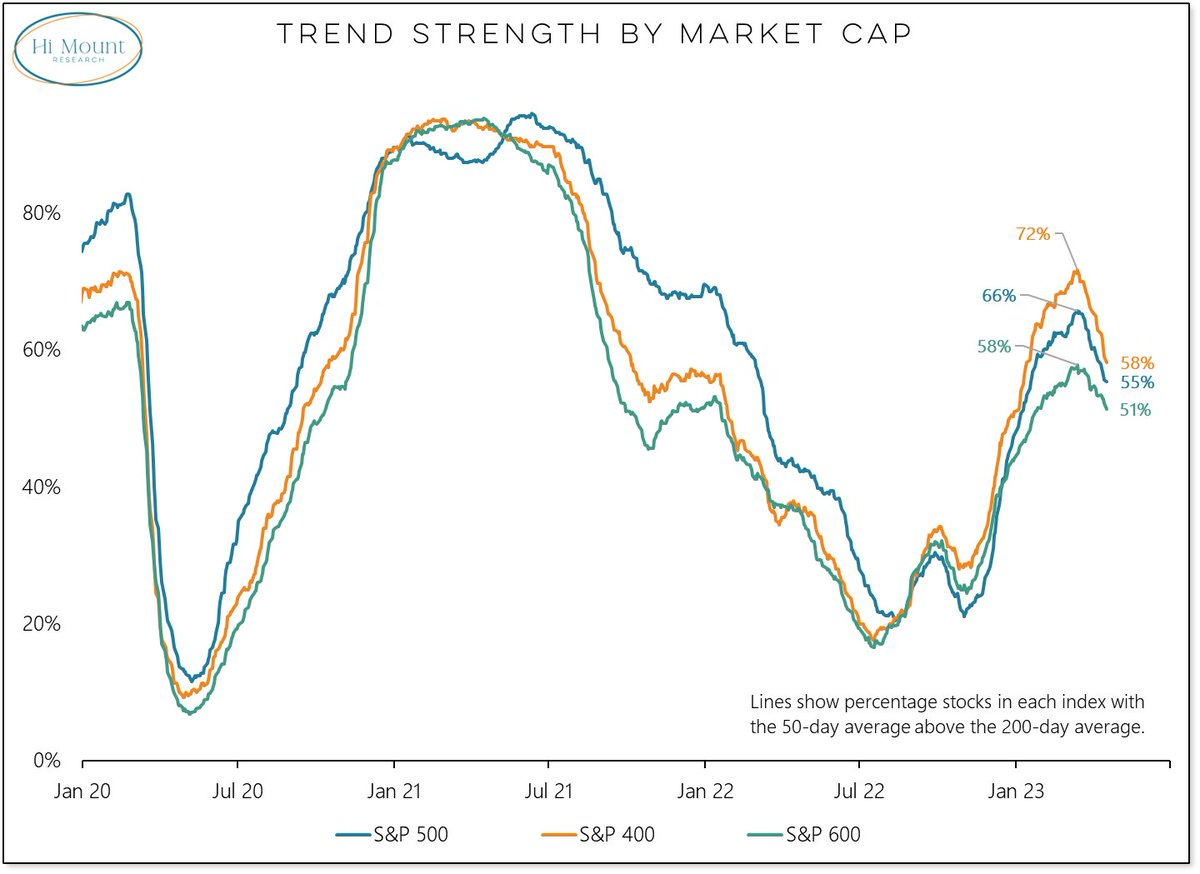
6. Slippery Slope: This interesting trend strength snapshot shows the proportion of stocks in the Large (500) Mid (400) Small (600) S&P indexes which have their 50-day moving average tracking above their 200-day moving averages (aka a “golden cross“ — an imperfect but useful proxy for up vs down trend). Key point is they’re all turning down and all middling about the 50% zone. Overall I would say that this by itself is a bad sign as it shows the nascent bull trend losing strength.
Source: @WillieDelwiche Hi Mount Research via Daily Chartbook
7. US Government Default Risk? In case you missed it, the debt ceiling debate/debacle is once again coming back onto the macro-market horizon. For those who might have missed it, the last time this was a major issue was in 2011 when it became such a problem that S&P downgraded the US sovereign credit rating. The thinking is that the split in congress vs senate will mean a procedural lifting of the debt limit could end up as another vicious political battleground — the tail risk being a default if the limit is not increased in time. In terms of “in time“ …we don’t know exactly what that means: could be early June or sooner if a lower tax take means the government runs out of cash, or could be later. But basically it’s on the market’s visible horizon now and hence we see US sovereign CDS pricing surging (basically bets/insurance on US government debt default risk).
Source: @topdowncharts Topdown Charts
8. Financial Conditions: Aside from the fiscal risk, monetary risk is also on the table — the sharp bounce-back in financial conditions shows how the US bank rescue was a resounding (short-term) success ———> and your prize? Rate hikes are now back on the table in the first week of May as the Fed will no doubt note the big re-easing of financial conditions…
Keep reading with a 7-day free trial
Subscribe to The Weekly ChartStorm to keep reading this post and get 7 days of free access to the full post archives.


