
Weekly S&P500 ChartStorm - 22 March 2026
This week: technical check, inversion question, drawdowns, global tech, margin debt, valuations and positioning, earnings revisions, global macro pulse, stock return distributions, emerging markets...

Welcome to the latest Weekly S&P500 #ChartStorm!
Learnings and conclusions from this week’s charts:
Stocks are at a make-or-break point (major support level).
Conditions are increasingly oversold.
Sentiment and valuations have seen a partial reset.
(albeit from an overvalued/excess-greed starting point)
Pre-war, the global earnings/macro pulse was on a promising path.
Overall, as noted, it’s a dangerous setup (clear technical deterioration from a starting point of overvaluation and excess-greed, with downside tail-risks for the global economy). But at the same time, if we’re going to get a rebound (maybe a combination of no new bad news, or some less bad news) then technically speaking it’s a bit of a now-or-never moment…
1. Technical Check: my initial reaction on seeing this week’s technical-check chart is that we went from bad to worse. But on closer inspection it looks like we’re sitting at a major support level with 50dma breadth now into proper oversold conditions. Add to that Trump-talk around “winding down” military efforts, and a decent (albeit incomplete) reset in sentiment, and it looks like a key juncture.
(and if we don’t rally from here, I’d say next stop is 6000)
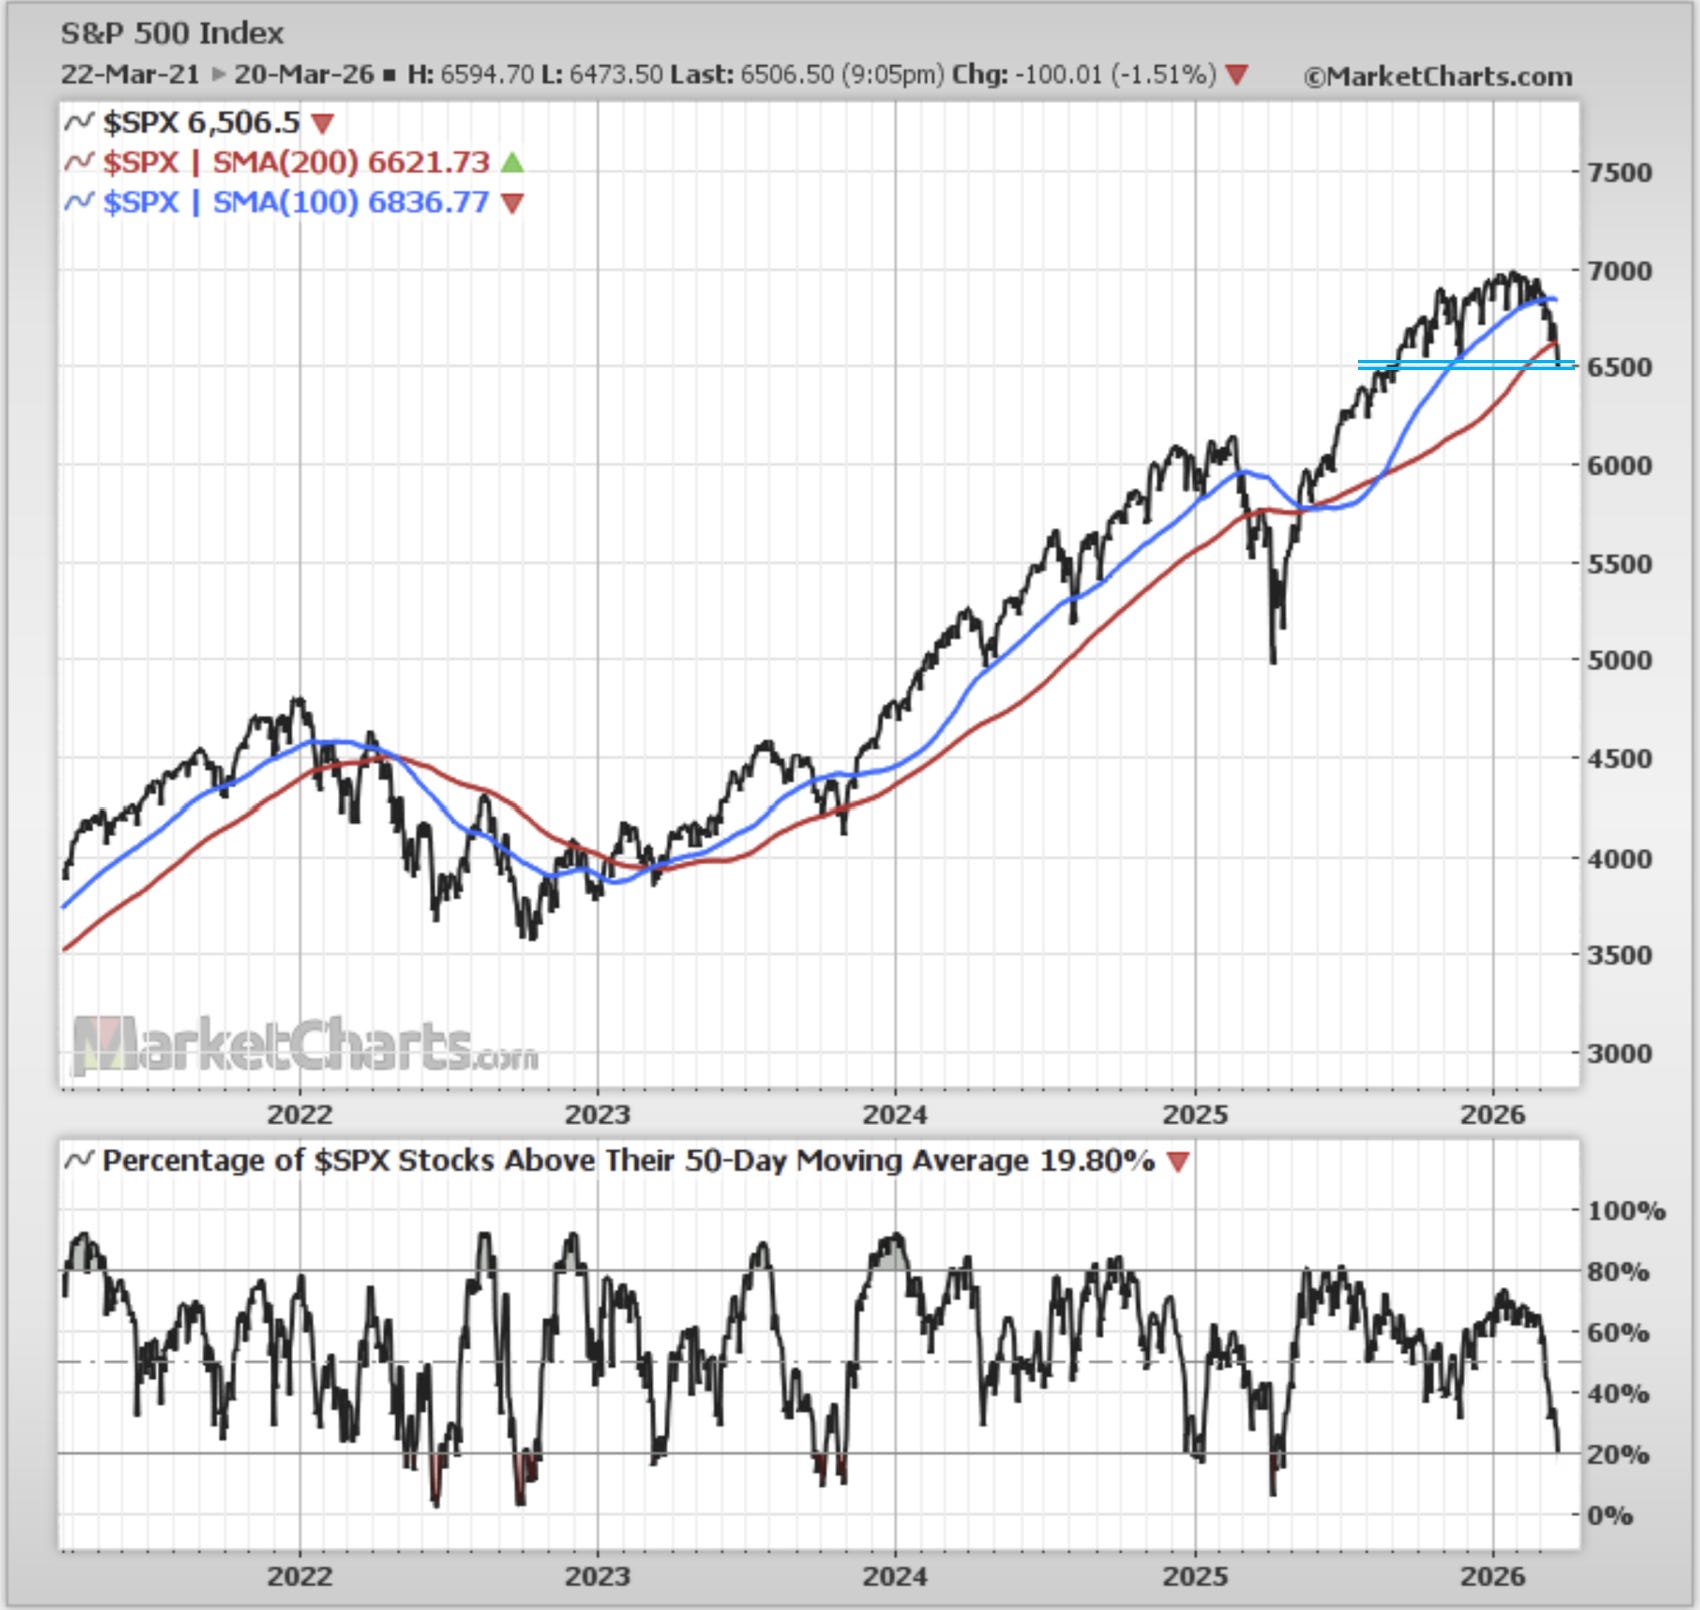
Source: MarketCharts.com
2. Would you buy it? On that note, as a bias check for bulls, flipping the S&P500 upside down …it kind of looks bullish (which is not a good thing).
Credit to The ChartReport for inspiring this one.
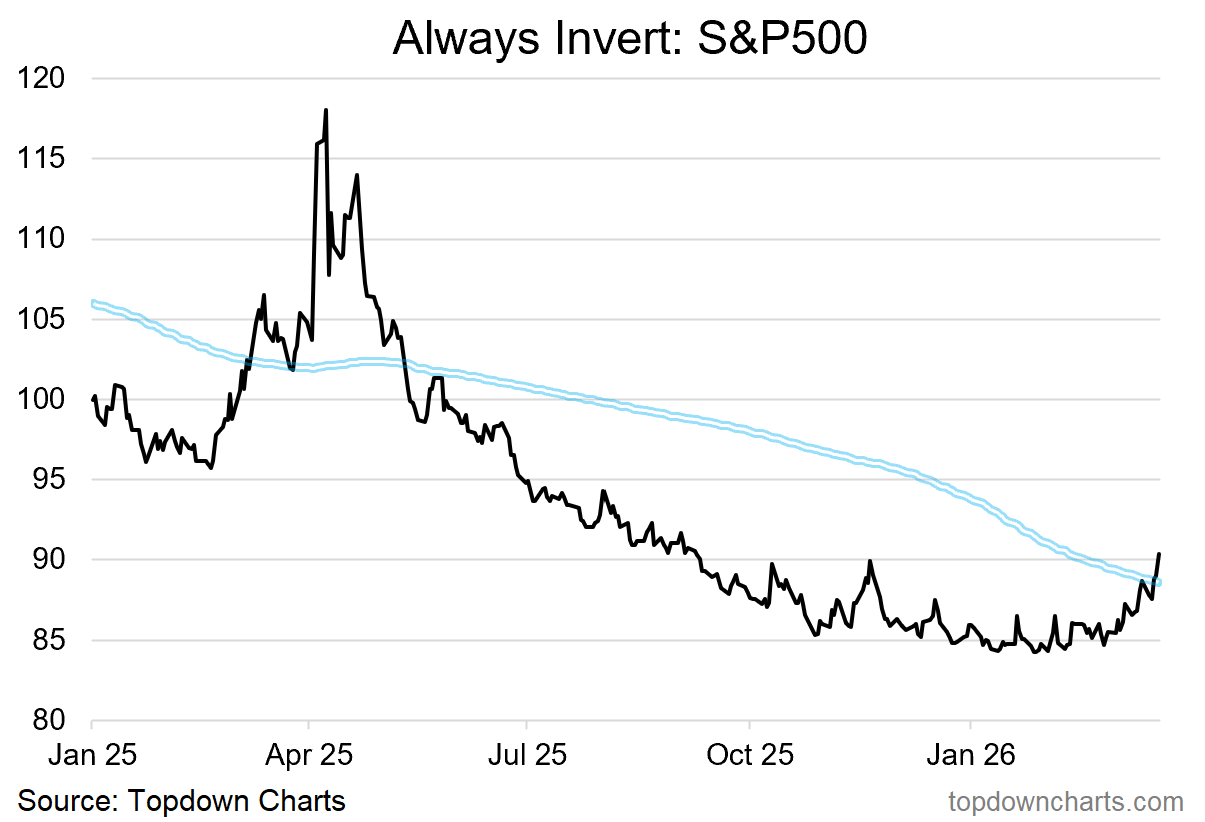
Source: Topdown Charts Professional
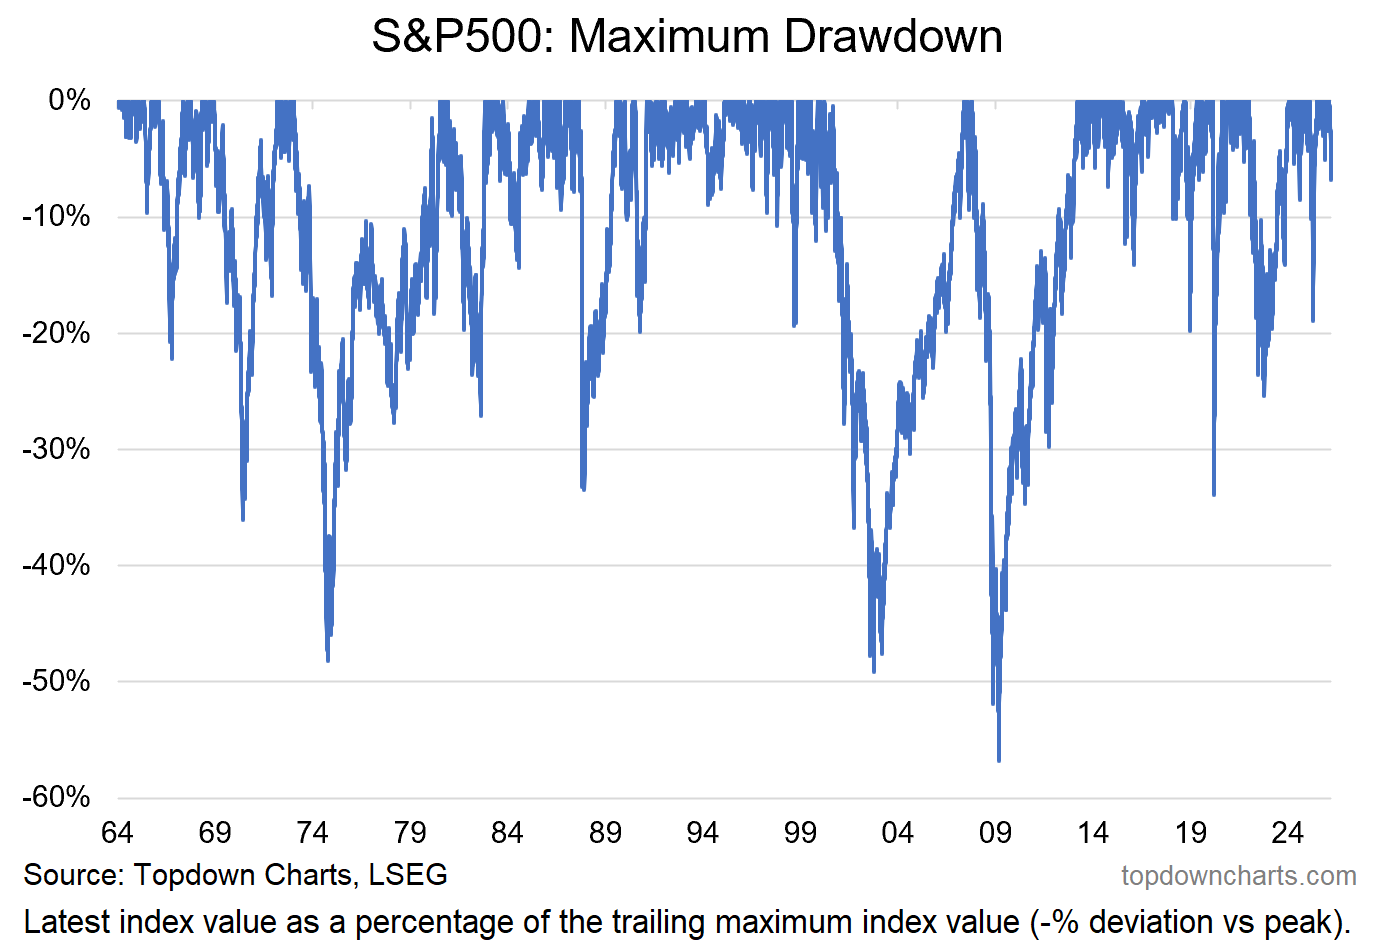
3. Drawdown in Context: worth keeping in mind, 5-10% sell-offs are very common, 10-20% corrections at not uncommon, and 30%+ drops happen ~once per decade (you will likely see multiple of them during your lifetime). And another thing, not all sell-offs turn into bear markets, but all bear markets start as a sell-off!
4. Global Tech Bull… on the bearish side, the global tech bull market is steadily losing soldiers; 200-day moving average breadth across countries is down to 50% and the world tech index peaked months ago +is in a (so-far gentle) downtrend.
