Weekly S&P500 ChartStorm - 21 July 2024
This week: stockmarket drawdowns, tactical downside risks, peak prospects, Wall Street vs Main Street, demand issues, best stocks of all-time, time-in, valuations and the market confidence structure
Welcome to the latest Weekly S&P500 #ChartStorm!
Learnings and conclusions from this week’s charts:
The S&P 500 selloff is just under 3% so far.
The selloff is driven by tech weakness (>5% down).
This follows a period of extreme optimism, bullish consensus.
Pressure points (macro, value, sentiment) highlight downside risk.
“Time-in the market” is true but tricky.
Overall, as explained in more detail below, the big risk from here is that the current selloff shakes previously strong confidence and sets off a number of pressure points in the market.
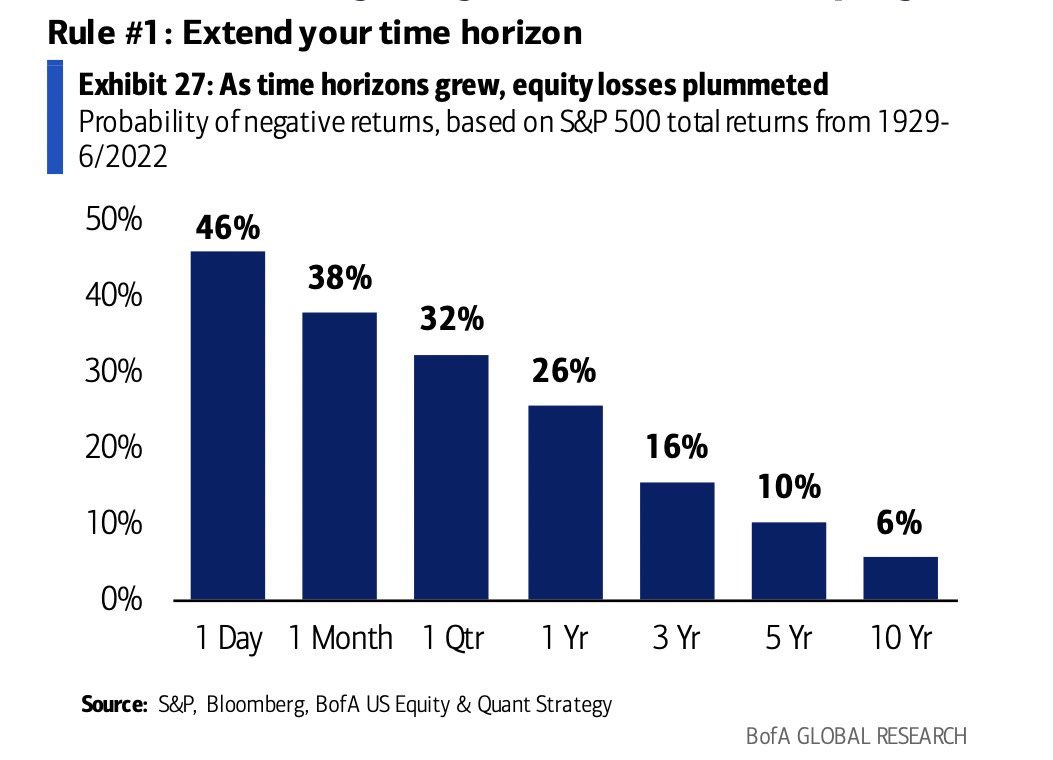
1. Minimal Drawdown: So far the drawdown in the S&P500 is just shy of -3% (which barely registers on the chart below — and as a reminder from that chart: 5-10% selloffs are very common, and 10-20% corrections are something you will see many times in your investing life, and even 20-30% dumps are not uncommon).
As flagged last week, an emerging rotation trade rippled across markets last week with mag7/big tech getting sold (Nasdaq drawdown is over -5% so far) …and small caps getting bid (part of that was an unwinding of the popular short small caps vs long big tech trade by hedge funds). The risk from here is that this seemingly innocuous rotation trade turns into a house of cards effect where confidence in big tech gets shaken and a larger correction takes hold.
Source: Topdown Charts (see also Perspectives Pack)
2. Preconditions: One of the pressure points prior to the current selloff has been the return of speculative fervor. Greed/optimism/bullishness is the dominant mood (as previously documented — across flows, positioning, surveyed sentiment, and even also evident in valuations and earnings expectations).
Source: Topdown Charts Professional
3. Peak Possibilities: This version of the Equal vs Market Cap weighted S&P500 relative performance path highlights the prospect that we are in a potential peaking process. Indeed, any time you get a particular stretch or extreme building up like this it presents a real risk that a seemingly small selloff spirals into a deeper downturn.
Source: @albertedwards99
4. AI High: It’s the worst kept secret in markets that AI is a bubble (or at least bubble adjacent), but we all know that it might be different this time, and that AI has the potential to really change the world in a meaningful way… the trouble is we don’t really know how or in what way or to what extent and how soon that will ultimately happen, but collectively we play a guessing game via the markets: attempting to price in and cash in on the promise of a brighter tomorrow. But these things go in cycles, and people tend to get carried away. So again, the risk in the immediate term is that we see an exhaustion of AI optimism.
Source: @Mayhem4Markets
5. Markets vs Economy: Further on the sentiment and cycles aspect, it’s interesting how investor sentiment surveys remain firmly and extremely optimistic, while economic surveys (consumer confidence, services, housing, manufacturing) continue to limp along at recessionary levels. I think part of this may be the lingering malaise around the inflation shock (i.e. real incomes are still below peak). But it is another example of how if investor sentiment comes down to meet somber economic sentiment that probably happens in the form of weaker stock prices.
Source: Topdown Charts Research Services
6. On Demand: While there are still plenty of points of resilience and even strength in the economic data, there are still some weak spots too (the K-shaped economy: winners and losers from the rates/inflation shock) — and companies are still mentioning how demand remains weak. Maybe this is just an issue of a high bar being set during the covid reopening stimulus fueled bounce-back, and merely middle-of-road growth seems short vs that brief boom.
Source: Daily Chartbook
7. Temp Market: In terms of the mixed macro, one weak spot has been the drop-off in temp employment — notable because temps are typically the first to go during a slowdown as firms look to cut costs. Albeit part of the weakness this time may be a lingering effect of labor shortages (companies opt to convert temps to permanent due to the difficulty of finding and retaining talent). Caveats and complications aside, it is an interesting datapoint alongside the other puzzle pieces.
Source: @LanceRoberts
8. Best Stocks of All-Time: Thanks to Meb Faber for flagging this excellent paper by Hank Bessembinder. The study looks at individual stock returns through history (albeit only from 1925 onwards). The standout for me was this table showing some the strongest (cumulative) returning stocks of history. A key point in common is the age (most of these companies were in existence during the 1920’s-30’s) — time in the market, or long-term compounding is the key (survivorship bias aside).
Source: Which U.S. Stocks Generated the Highest Long-Term Returns?
9. Time-in: It brings to mind the old chestnut of “time-in-the-market” — which states the longer your holding period, the more likely returns are to be positive. But a couple of points, first; even a longer holding period does *not* guarantee positive returns, and second; smart diversification and risk management should be able to help smoothen the path and help your odds.
Source: @MichaelAArouet
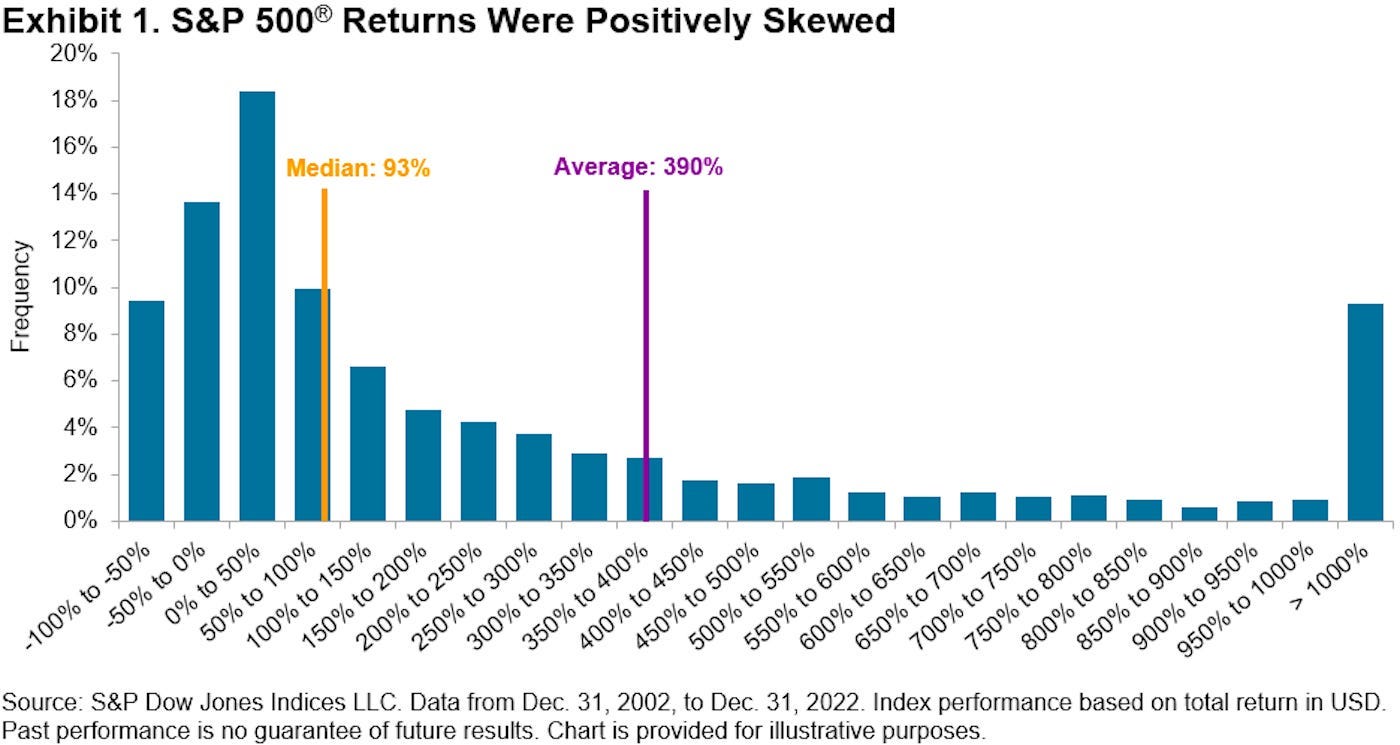
10. Another Issue: One problem with time in the market (aside from a sometimes extremely treacherous path — see chart no.1 this week) is that a significant number of stocks go to zero or pretty close to it over the long run (some simply delisting or getting taken out by M&A during their decline), while a select few shoot the lights out. All goes to show that it’s often a little more complicated than what the popular platitudes profess.
Source: TKer by Sam Ro
Thanks for reading, I appreciate your support! Please feel welcome to share this with friends and colleagues — referrals are most welcome :-)
BONUS CHART >> got to include a goody for the goodies who subscribed.
Tick-Tock for Tech-Top — TMT Valuation Extremes: Another important puzzle piece in thinking about peak prospects is the surge in tech stock valuations past the 2021 peak.
While it is *possible* that these valuations head even higher from here (dot com showed us anything is possible if you just believe), the problem is that this becomes a key pressure point.
The other way to think of valuation indicators like these is as confidence indicators — the market is currently expressing extreme confidence in the ability of tech stocks to continue to turn in strong earnings growth, especially with the eternal hope of AI dreams.
This becomes a major vulnerability because you need the story and narrative to stay strong and even strengthen, and the moment you get even a small selloff it raises doubts. Doubt is the enemy of bubbles and market manias.
While I don’t know what’s going to happen next, when you have these background starting conditions, the risk of deeper downside is credible…
—
Best regards,
Callum Thomas
Looking for further insights? Check out my work at Topdown Charts


Join the discussion in the new ChartStorm ChatRoom: https://www.chartstorm.info/chat
After looking at #8 Best Stocks of all Time, I thought there must have been many children/grandchildren who inherited those stocks and immediately sold them without really considering the big picture. That was interesting!