Weekly S&P500 ChartStorm - 27 October 2024
This week: technicals check, sentiment, valuations, expected returns, private equity risks, fund managers, bad returns, gold, and the gold/stock ratio...
Welcome to the latest Weekly S&P500 #ChartStorm!
Learnings and conclusions from this week’s charts:
Stocks are pulling back from the highs, breadth rolling over.
Long-term sentiment measures are reaching new highs.
Valuations are increasingly expensive, risky.
Long-term expected returns are therefore likely to be lower.
Private equity is showing signs of congestion, excess demand.
Overall, there is a clear sense of apprehension starting to set-in — it looks like stocks are pulling back as folk look to de-risk into the election. The election may well trigger or clear the path into a year-end rally, but as we look at in this week’s charts; there’s still a lot of inconvenient data for buy and hold stockmarket investors, and prompts to ponder on asset allocation.
Threads? I’ve started using Facebook/Instagram’s new platform called “Threads” (kind of similar to Twitter/X), so far my impression is it looks and feels similar to Twitter/“Fintwit” back in the pre-2016 period, very clean and simple. If you’re on there be sure to connect: @topdowncharts
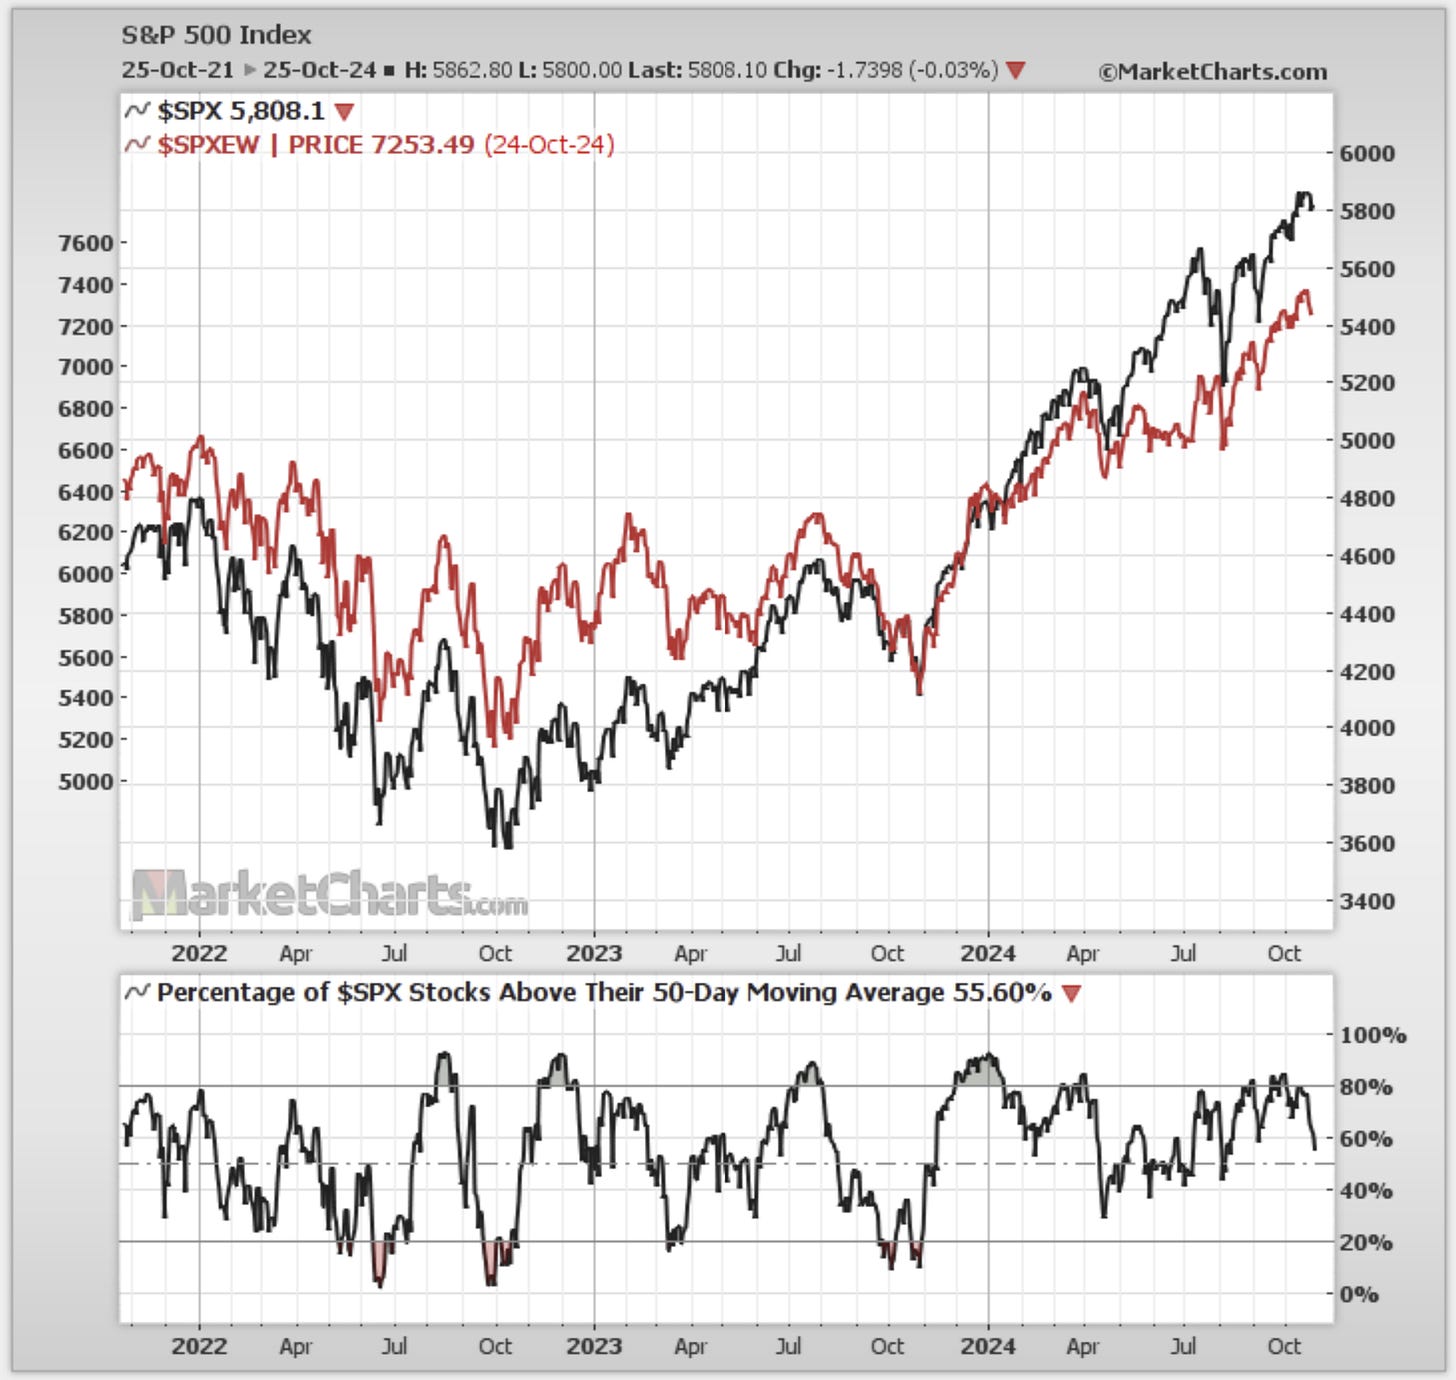
1. Easing Off: After a relatively strong run this year, the S&P 500 looks to be easing off heading into the election (5th Nov). There are a few other bits and pieces of uncertainty, but that really is the main one… and provided that we get a clear outcome, it has the potential to be a risk-clearing event; something that results in the dissipation of uncertainty and allows volatility to fall and stocks to rise (at least until the next worry list comes around!)
But focusing on the technicals, clearly the index is in the process of easing off from the highs, with breadth also rolling over. As noted I think part of this is just going to be folk reducing exposure, sitting it out.
Source: Callum Thomas using MarketCharts.com Charting Tools
2. Big Bulls: Having said that, we can’t be entirely complacent either — it has been a very strong run in stocks, and we have witnessed a sharp lift in valuations and sentiment. The Euphoriameter is a good example of this; and it just made another new all-time high in November as momentum prevails.
Source: The Euphoriameter from Topdown Charts Professional
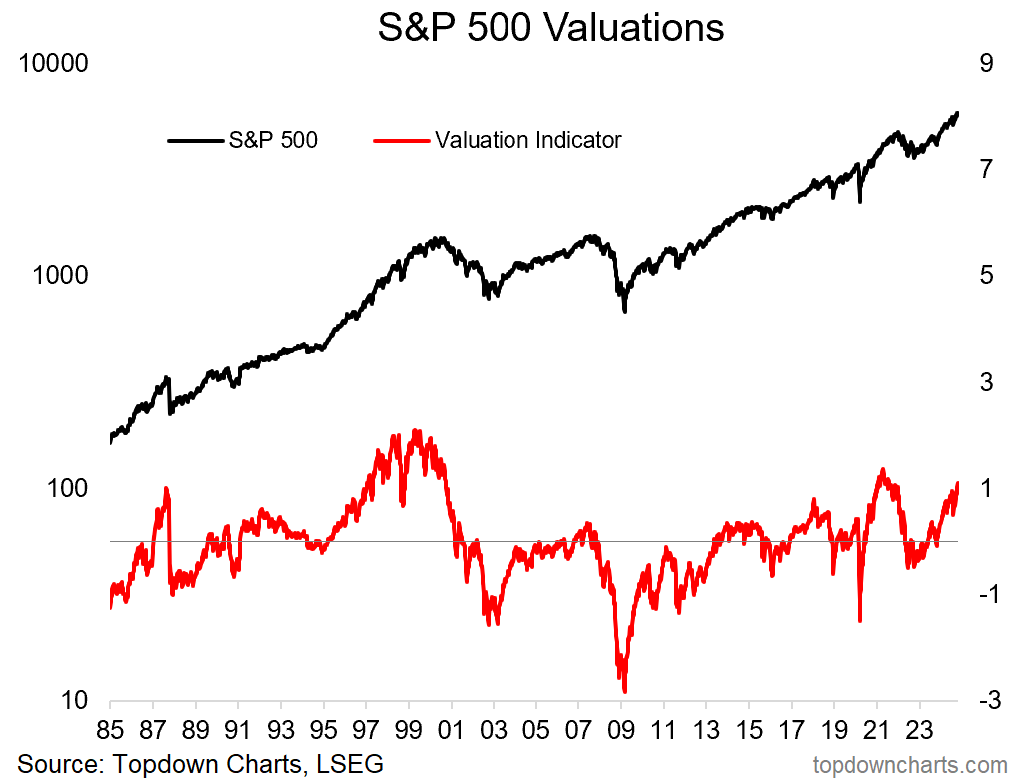
3. Valuation Heights: Looking specifically at the valuation side of things, my S&P500 valuation indicator is right into the risky zone here. This is a big problem — not just because of the direct implications of this (lower expected returns, risk of downside, blah blah) …but rather because of 1987 vs 2000. When it peaks it can turn very sharply and quickly (1987), but it can also take a long time, and go on higher for longer than you might expect (2000). Either way though, the implications are clear.
Source: Topdown Charts — Indicator Methodology + Concepts
4. Burdened by What is: Taking another angle on it, given current valuations we should temper our expectations of future prospective returns based on the most objective evidence we have (the historical data). In other words, the price —the valuation you pay has a big impact on your future returns (the higher you pay, the higher you need to sell to make money).
Source: How it Ends: A Decade of Low Returns?
5. Burdened by What has been: And a similar but different analysis, usefully this looks at the equal-weighted index (and so provides another angle on it, or verification). Again, given current valuations, based on historical data, we should temper our expectations… i.e. not expect the past decade of very strong returns to repeat; instead expect either lower or at times negative returns.
Source: @LeutholdGroup via @MebFaber
6. What might be: And yet another angle and way of visualizing it; again, we should expect as a minimum some moderation in returns — at best: simply lower than the previous decade, and at worst: negative. So from a tactical and strategic standpoint, the current valuation settings make for a challenging outlook for the stockmarket. Things might be different, maybe tech/AI changes the game, maybe something else happens to make it better than predicted, but that requires informed imagination vs the verifiable historical evidence/data.
Source: @MikeZaccardi
7. PE no Alternative? Many folk have turner to private equity and venture capital (among other things) as an alternative to the stockmarket in the quest of achieving higher returns with lower risk. But the problem with that is the more people head into private equity, the more risky it becomes, the more bottlenecks become apparent (e.g. this chart), and the lower the returns should ultimately be as a result of simple old supply and demand. And another thing, if stockmarket investors are paying high valuations, what do you think PE investors are paying?


