Weekly S&P500 ChartStorm - 20 October 2024
This week: tech stocks, bitcoin, seasonality, volatility, taxing times, earnings strata, wealth effects, accounting for accountants, unequal weightings, concentration...
Welcome to the latest Weekly S&P500 #ChartStorm!
Learnings and conclusions from this week’s charts:
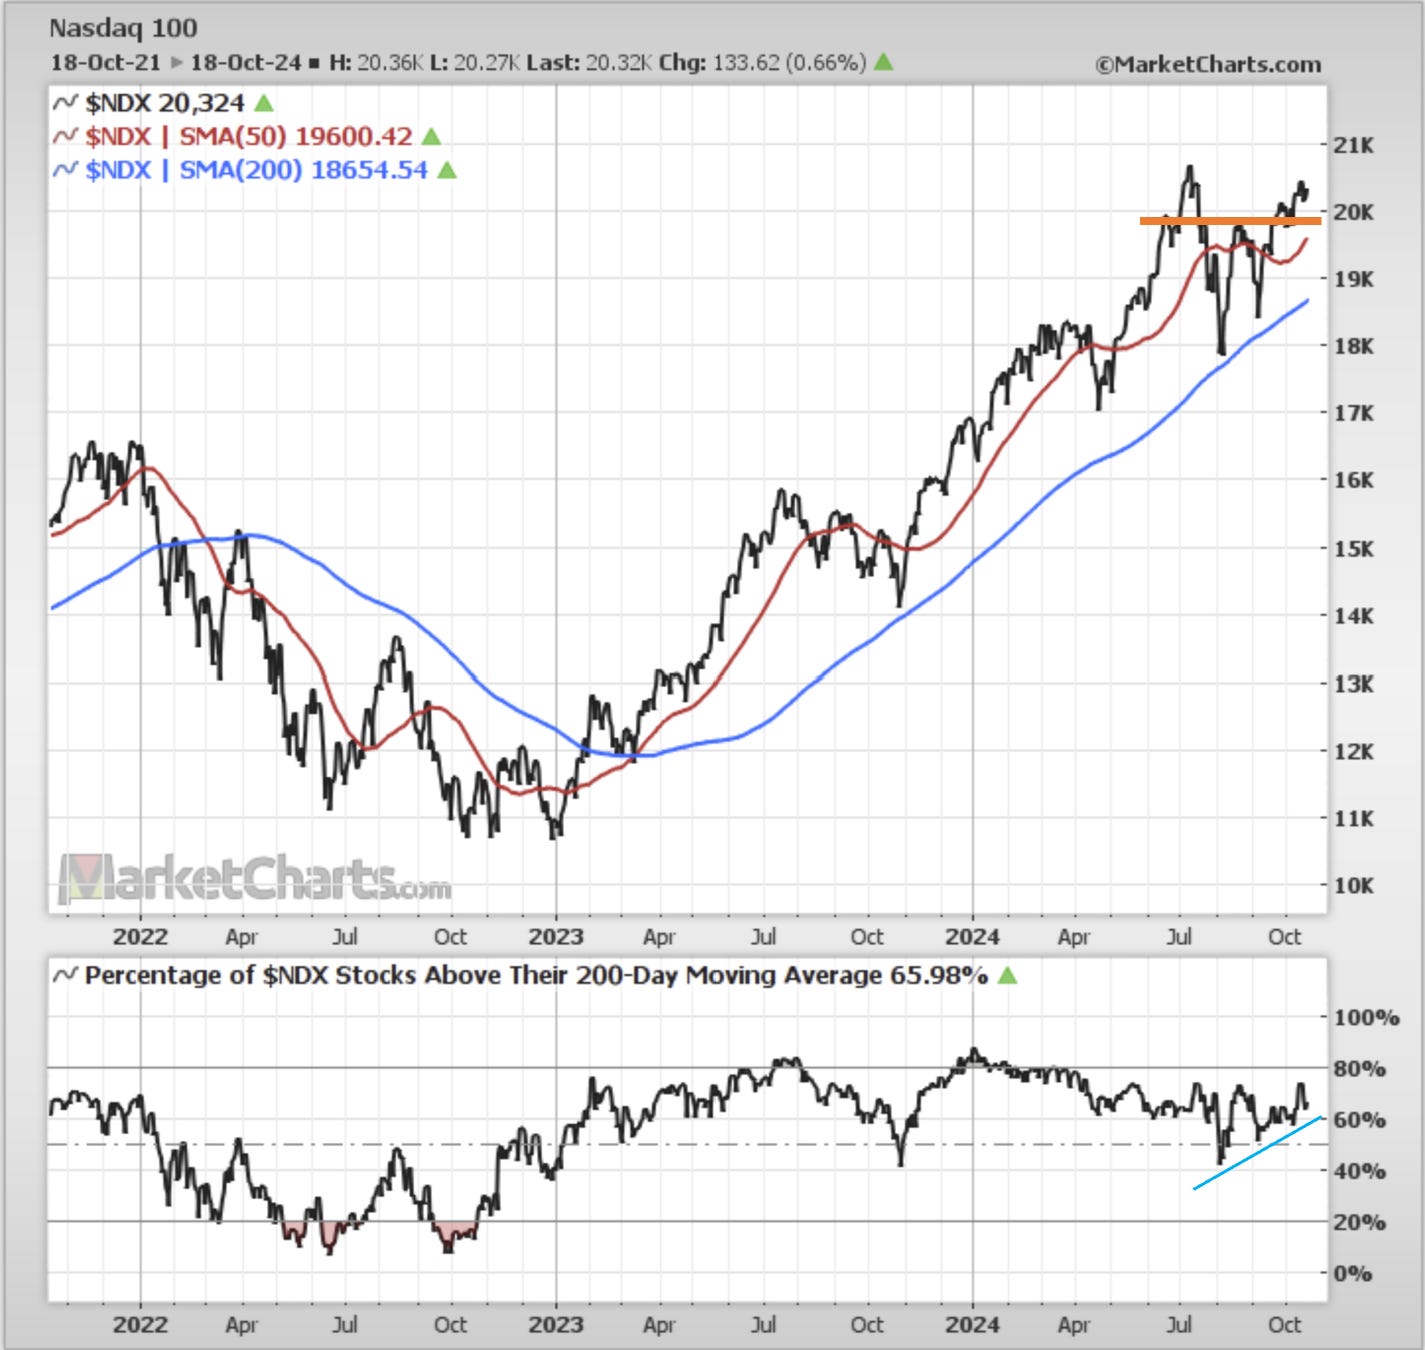
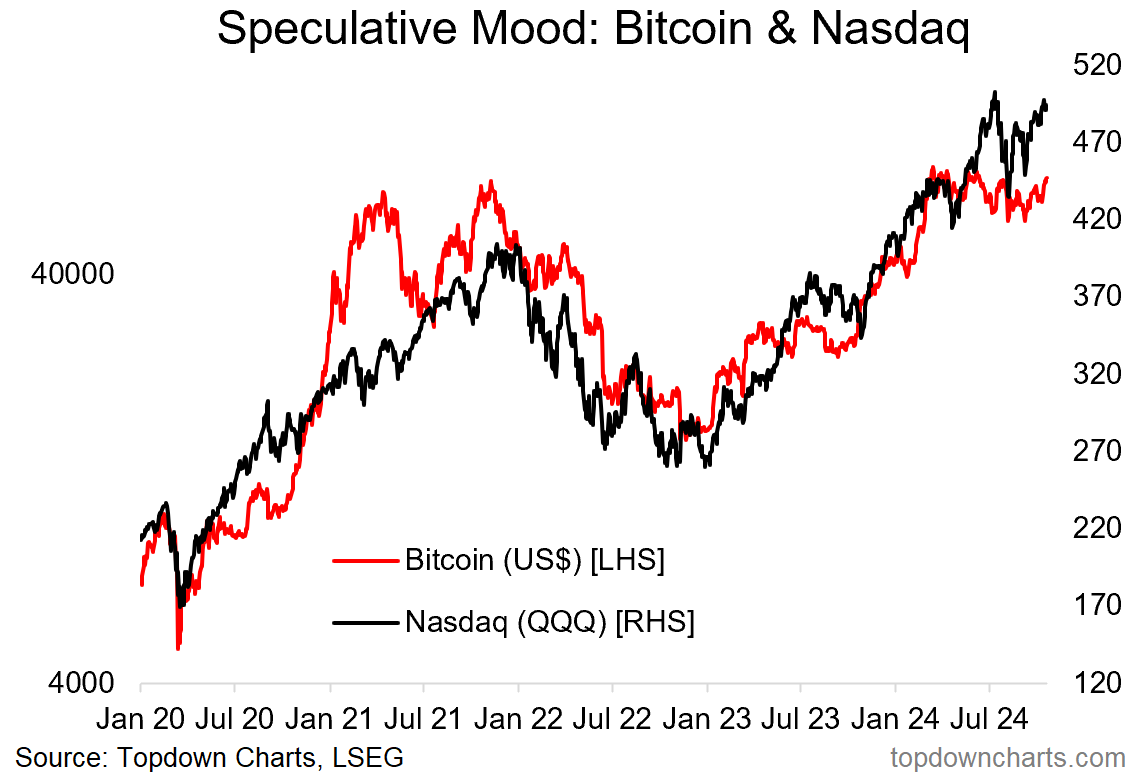
Nasdaq has broken resistance, Bitcoin gaining too.
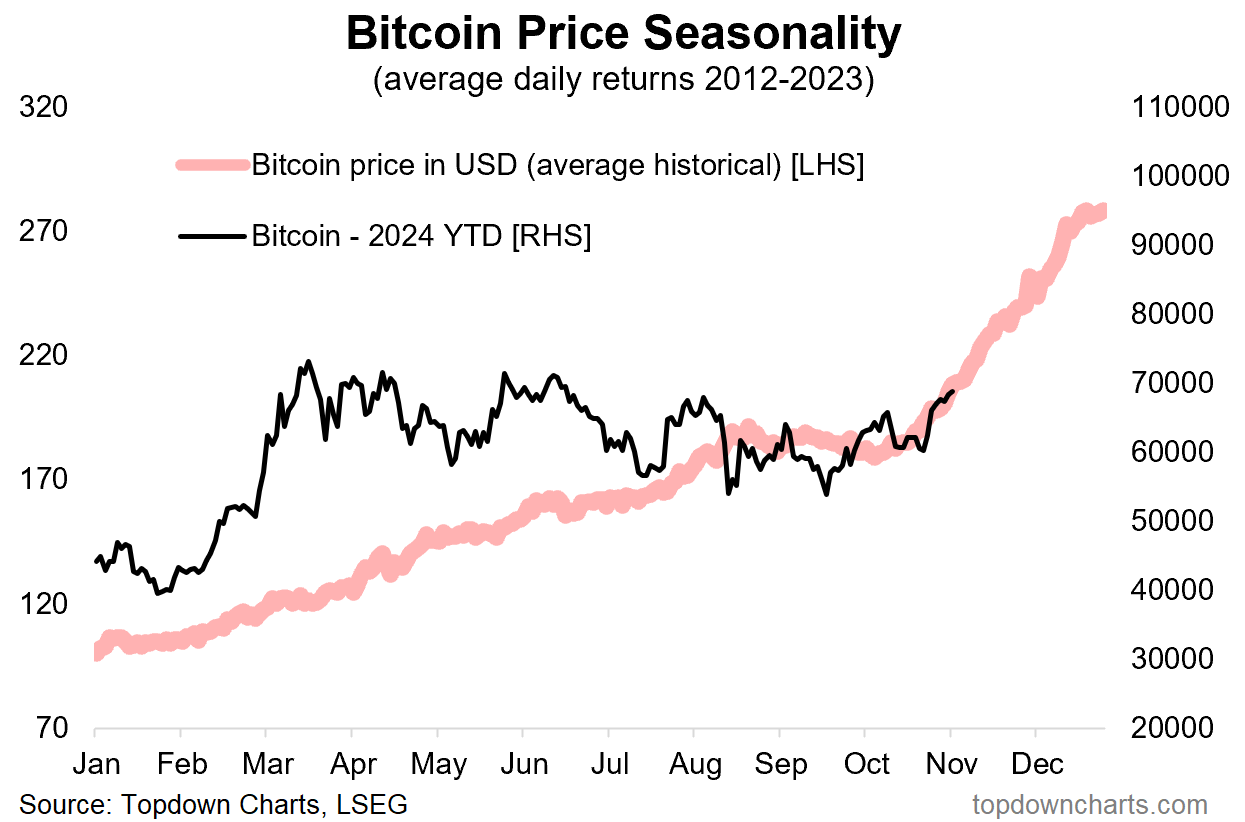
Bitcoin/risk assets are scheduled for a seasonal boost.
(but) Volatility season is not over yet.
Election is set to deliver a binary corporate tax outcome (up vs down).
There is a generational opportunity emerging in equal vs cap weighting.
Overall, there is certainly an air of optimism in markets, and a clear upshift in speculative mood on display in the charts. And fair enough; there has so far been no major bad news, the Fed has pivoted to rate cuts, and seasonality is set to turn positive. Yet we can’t drop our guard entirely as there remains unfinished business on a number of fronts. So keep watching those charts…
REMINDER: the new Weekly ChartStorm Chat-Room is now up and running — I will host a live Q&A session on Sunday evening about 7pm EST.
1. Onwards: Well, it finally happened, the Nasdaq has broken out of it’s period of angst and consolidation — pretty much cementing the notion that it’s still in an uptrend. The only thing left to do from here is notch up a new high (and it probably will).
Source: Callum Thomas using MarketCharts.com Charting Tools
2. Mood Up: Looking over at the Nasdaq’s traveling companion, Bitcoin — there does seem also to be a broader shift in mood. Whether it’s optimism around the possible election outcome, the lack of any real bad news, or simply the Fed pivot to rate cuts… the mood sure seems to be shifting to the upside after a period of what we might call a stealth bear market.
Source: Topdown Charts
3. Year-End Really? And after-all, there is a clear seasonal tendency for risk assets to rally in the final months of the year, and Bitcoin is an extreme example of that. While we are still only looking at 12 years of data here, it’s still something, and the seasonality pattern (average daily movement by business day of the year) suggests a surge in Bitcoin into year-end; this *if it happens* would likely reflect and ripple across price action in stocks and risk assets in general. Very bullish chart.
Source: Topdown Charts Research Services
4. But Wait, There’s More! Having said that, there are still a bunch of macro-market boogeymen lurking in the shadows (election, geopolitics, stretched sentiment/valuations, recession risk), and we are not quite out of the woods on seasonality just yet. Maybe one more VIX spike before the year-end vol-crush and risk-on ride…
(but also, a timely point to remind folk that seasonality is just an average, and there are many exceptions to the rule! aka in the words of Ron “60% of the time it works every time”)
Source: Chart of the Week - Volatility Season
5. Binary Tax Take: As for just plain volatility, here’s reason enough for uncertainty to linger for stocks at least for the next couple of weeks — as far as we can tell, Harris and Trump want opposite things when it comes to the corporate tax rate. Ignoring everything else, higher corporate tax rates are bad for stocks (and lower good) — the table below shows the potential impact in detail across sectors (aka: “it’s the earnings, stupid”).


