Weekly S&P500 ChartStorm - 20 November 2022
This week: FOMO flows, market breadth bugle, economic recession and earnings, China speculation, stocks vs bonds, stocks vs fed liquidity model, the many minds...
Welcome to the Weekly S&P500 #ChartStorm — a selection of 10 charts which I hand pick from around the web and post on Twitter.
These charts focus on the S&P500 (US equities); and the various forces and factors that influence the outlook - with the aim of bringing insight and perspective.
Hope you enjoy!
This week’s edition is sponsored by The Daily Upside
There’s a reason our friends at The Daily Upside are the fastest-growing finance newsletter in the world. See why close to a million readers trust their expert team for crisp, easy-to-read market insights – free, always. Sign up today
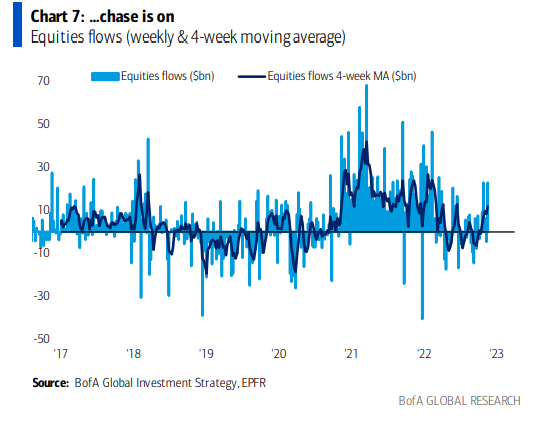
1. FOMO Flow: Yes, downside risk is scary... But I'd say probably still the greatest fear out there among traders/investors is missing out if the market rips and runs away on you (which is entirely possible when sentiment is very pessimistic and how readily the crowd has jumped on any glimmer of pivot hope, and this sort of thing is likely front of mind for many following what happened in 2020). This chart presents a glimpse of this behavior in action.
Source: @MikeZaccardi
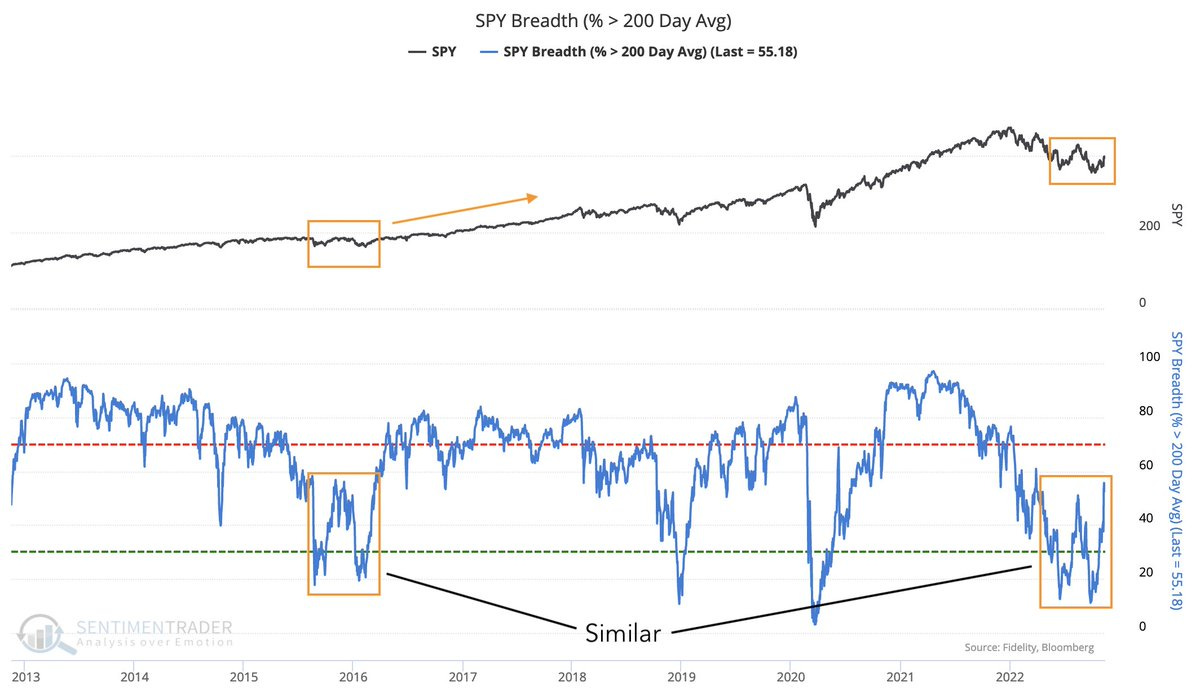
2. Breadth Bugle: Is this familiar breadth pattern a rallying cry for bulls?
We do need to pay attention to what price is telling us… but I would note the macro setup was very different in 2015/16 -- China/ECB/BOJ rode in with big stimulus, the Fed did a 1-and-done rate hike pause, and the global economy narrowly avoided recession, and inflation was not an issue (deflation was). Maybe a macro catalyst becomes obvious in hindsight, but as things stand I can’t see an obvious driver for follow-through in this one (yet?).
Source: @GameofTrades_
3. Dollar Dynamics: Weaker US dollar = easier global financial conditions = big bounce in global equity breadth...
US Dollar = 🗝️
Source: @allstarcharts via @WillieDelwiche
4. Have a hmm...
hmm 1: "historically stocks never dropped during the 3rd year of the Presidential Cycle (i.e. next year, 2023)"
hmm 2: "there has never been a recession in the 3rd year (yet)"
(hmm 3: there likely will be a recession in 2023)
Source: @MikaelSarwe
5. Earnings (bearish)Momentum: (recession = EPS 📉=stocks 📉)
As noted the other day, there are numerous signs pointing to global recession, and so far arguably this year’s bear has been more about geopolitics and rates shocks rather than declining earnings as such.
Source: @asr_london
6. Earnings Macro (pt2): Another angle, aka why bother looking at the PMI — S&P 500 earnings revisions trace a very similar path to the new orders component of the ISM PMI.
Source: @MichaelKantro
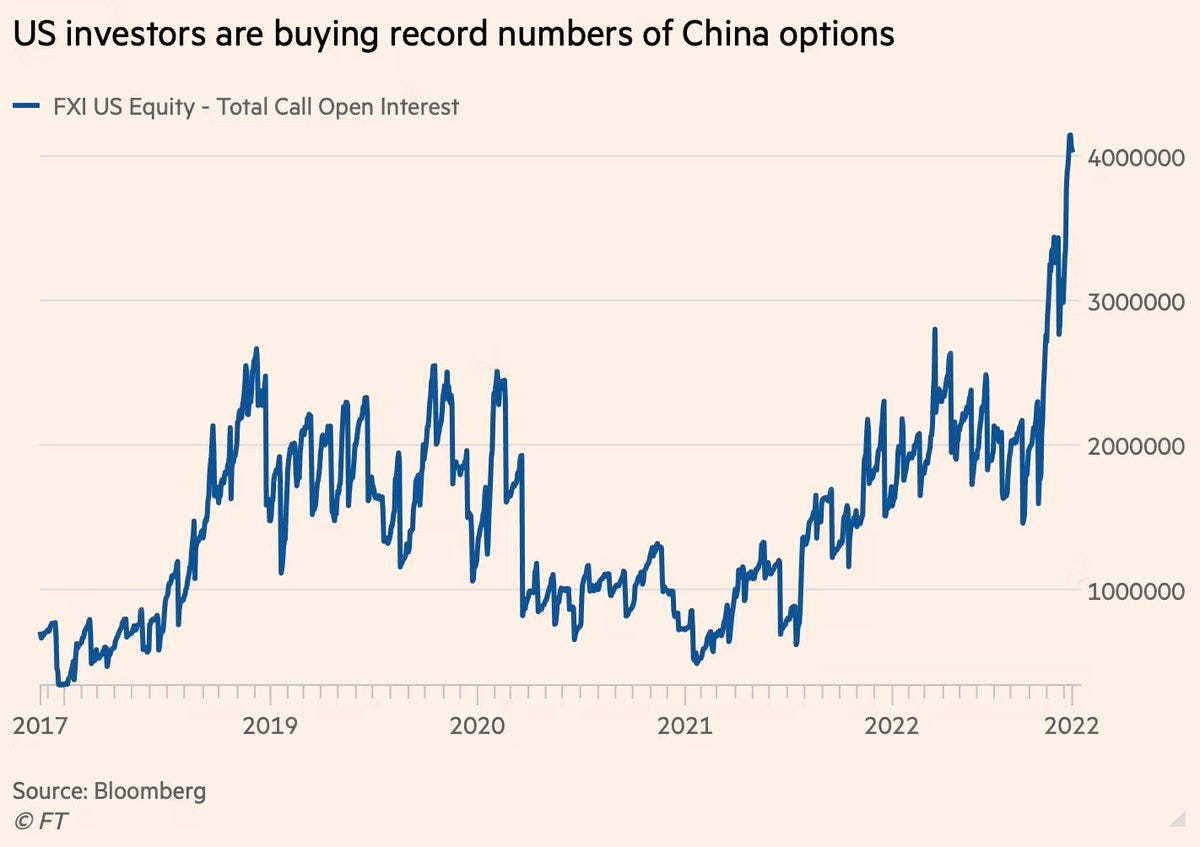
7. Calling on China: While many commentators have been running with the "China is uninvestable" assertion, traders have been furiously buying up call options on Chinese equities (most likely betting on the prospect of a policy pivot away from covid-zero by China at some point in the near future).
Source: @AyeshaTariq
8. Stocks Expensive: Despite the fall, stocks are showing up expensive vs bonds on a number of models, e.g. such as the one below. That means the odds are in favor of bonds outperforming stocks going forward...
Source: @Lvieweconomics
9. Correlation Reorientation: I agree with this, an eventual transition in focus/macro narrative by the markets from inflation risk to growth risk will reactivate the more traditional negative correlation between stocks vs bonds (which following on from the previous chart, most likely expresses as bonds up, stocks down).
Source: @MikeZaccardi
10. "Fed liquidity-implied fair value"
Current level of the S&P 500: 3965
Current model suggested Fair Value: 3600
Fair Value of model by the end of the year: 3400
(i.e. stocks are still overvalued going off this indicator)
Source: @steve_donze
Thanks to this week’s sponsor: The Daily Upside.
Wall Street’s inner circle is addicted to this newsletter
We’ve all seen the headlines. “Uncontrolled inflation” ripping higher at 10%+ has “wiped trillions of wealth” off the map in a matter of months. Sifting through this never-ending parade of fear-mongering could be a full-time job.
Luckily for us, we read The Daily Upside.
Founded by a team of former Wall Street veterans, this newsletter unpacks the story behind the story.
Why did private equity professionals pump in $150mm+ to Super Pacs this election cycle?
Will Ryanair be the only low-cost airline to survive?
The Daily Upside delivers an elusive balance between analysis and wit. Close to a million investors read The Daily Upside before the markets open, including the team at ChartStorm. Sign up for free.
BONUS CHART >> got to include a goody for the goodies who subscribed.
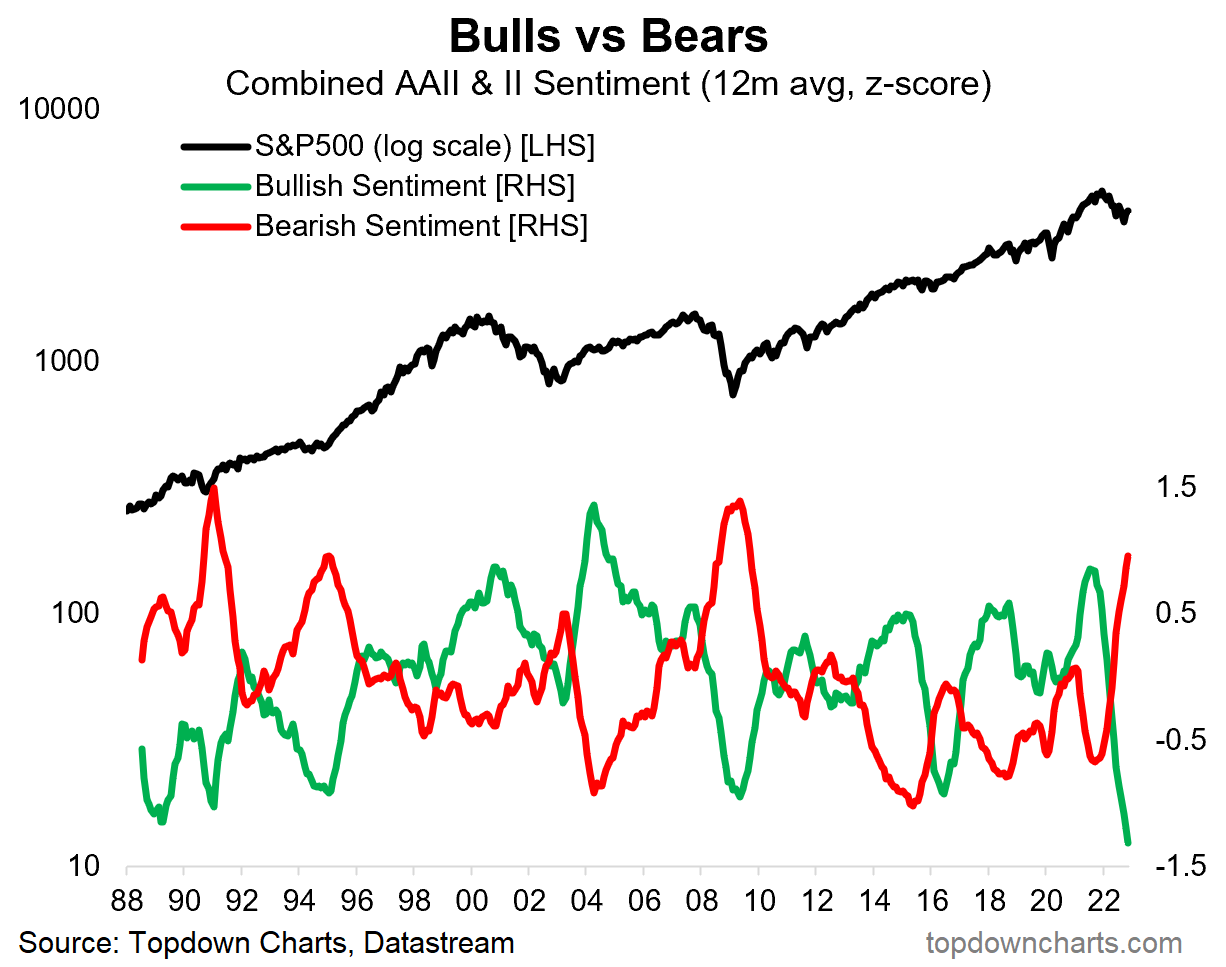
Long-Term Investor Sentiment: investor bullishness went from among the most bullish readings in 2021 to now *the* least bullish on record.
This chart tracks the combined readings from the AAII & Investors Intelligence surveys, and applies a 12-month smoothing to what can be a very noisy series…
This smoothing helps visualize the trends in investor sentiment from euphoria during bull markets to deep pessimism in times of crises and bear markets, and everything in between!
I always say when it comes to sentiment it basically carries 2 key forms of information:
Momentum information through the range as the crowd slowly figures out the narrative, chases past performance, gets carried along by the news/noise, and jumps on board the bandwagon.
And then contrarian information at extremes where everyone is on one side of the boat, and all it takes is a little rocking to throw everyone off. Or in other words, when there are a lot of minds that could be changed.
Usually contrarian signals are most potent when a sentiment indicator reaches an extreme and then pulls back, or e.g. around market bottoms when sentiment craters and then begins to turn up.
As things stand, sentiment is increasingly less bullish, and increasingly more bearish. Is it at contrarian levels yet? Probably close. Going by that previous comment; on both counts we’ve yet to see a turn in the indicators, so it probably still is a case of momentum information.
But it must be said either way that right now there are a lot of minds that could be changed if the right reasons came along…
—
Best regards,
Callum Thomas
My research firm, Topdown Charts, has a NEW entry-level service, which is designed to distill some of the ideas/themes/charts from the institutional research service to provide the same high quality insights at a more accessible price.
Give it a try and let me know what you think! :-)
For more details on the service check out this recent post which highlights: What you get with the service; Performance of the service; and importantly: What our clients say about it…


Want to sponsor the Weekly ChartStorm? https://chartstorm.substack.com/p/information-for-sponsorsadvertisers