Weekly S&P500 ChartStorm - 2 October 2022
This week: monthly charts, volatility, sentiment, technicals, market bottoms, bear markets, valuations, IPOs, Big Passive, global equity bearmarketometer...
Welcome to the Weekly S&P500 #ChartStorm — a selection of 10 charts which I hand pick from around the web and post on Twitter.
These charts focus on the S&P500 (US equities); and the various forces and factors that influence the outlook - with the aim of bringing insight and perspective.
Hope you enjoy!
NEW: Sign up to the (free) Chart Of The Week over at the new Topdown Charts Substack entry-level service: Subscribe to the Chart of the Week
Each week we send you one of the most interesting charts on our radar, along with commentary/context and a key takeaway — so you’re never left guessing on why the chart matters ...and the charts matter! > > > Subscribe Now
1. Happy New Month: The S&P 500 closed September down -9.34% on the month, and is now down -25.25% YTD. In real (CPI adjusted) terms it is back below the pre-pandemic highs.
Source: @topdowncharts
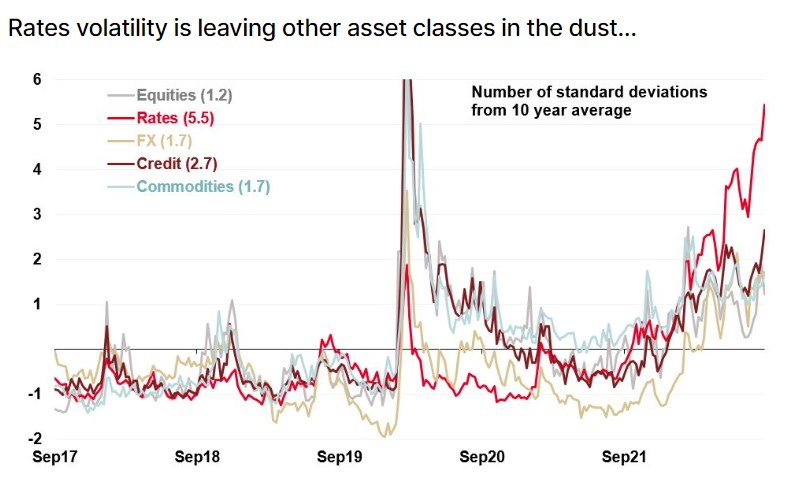
2. Rate Shock: 2022 has been a story of extreme interest rate volatility. As the rate shock ripples through the economy it's likely that volatility drifts higher across assets.
Source: @ReutersJamie
3. Bear Market Topography: Just a friendly reminder that bear markets happen across space and time...
Source: @MacroAlf
4. Stark Sentiment: No more bulls (aka — a lot of minds that could be changed...)
Source: @RenMacLLC
5. Extreme Oversold: The 24-month Williams%R Oscillator is showing up increasingly extreme oversold...
...albeit, the early-2000's shows how the market can stay oversold, and 08/09 shows how the market can get even more oversold!
Source: @CalebFranzen
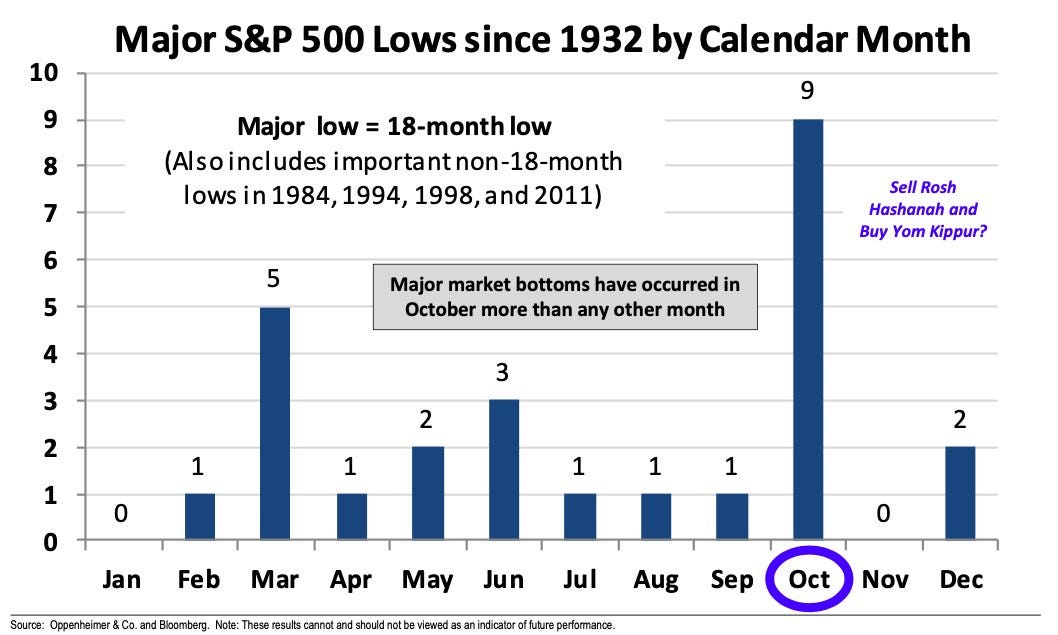
6. Welcome to October: Interesting historical statistics observation — "major market bottoms have occurred in October more than any other month"
(of course that doesn't preclude further downside even if it did bottom in Oct!)
7. Nasdaq Valuations: The median Price to Sales Ratio across the Nasdaq 100 has almost halved vs the peak (albeit is still almost double what it was a decade ago). Is this enough of a reset? (…especially: is it enough if sales drop and profit margins also correct from record high levels?)
Source: @charliebilello
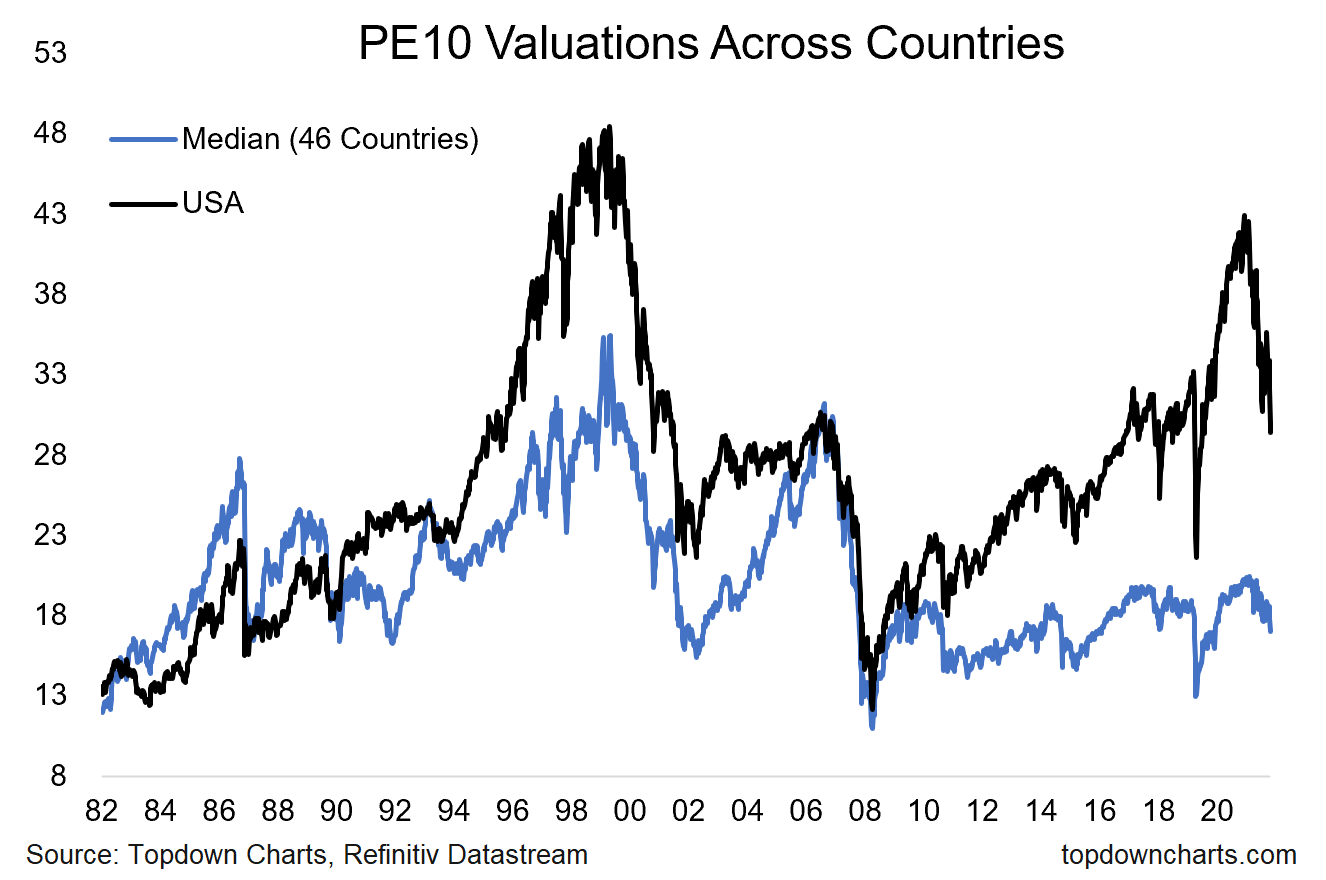
8. When Cheap? The US PE10 (price vs trailing average 10 years of earnings) valuation is down -31% from the peak (but still 13% above long-term average, and for what it's worth is still 73% above the rest of the world). So the question investors should be asking: “is 30%-off a good deal?“
Source: The 12 Charts to Watch in 2022 [Q4 Update]
9. IPO Boom and Bust: or aka capital markets with vs without excess liquidity…
Source: @GunjanJS
10. The Rise and Rise of Index Followers: “Big Passive” is the top holder of just about every stock now. Is this going to be a problem?
Source: @JSeyff via @EricBalchunas
Thanks for following, I appreciate your interest!
YOUR AD HERE? get in touch to enquire about sponsorship options.
BONUS CHART >> got to include a goody for the goodies who subscribed.
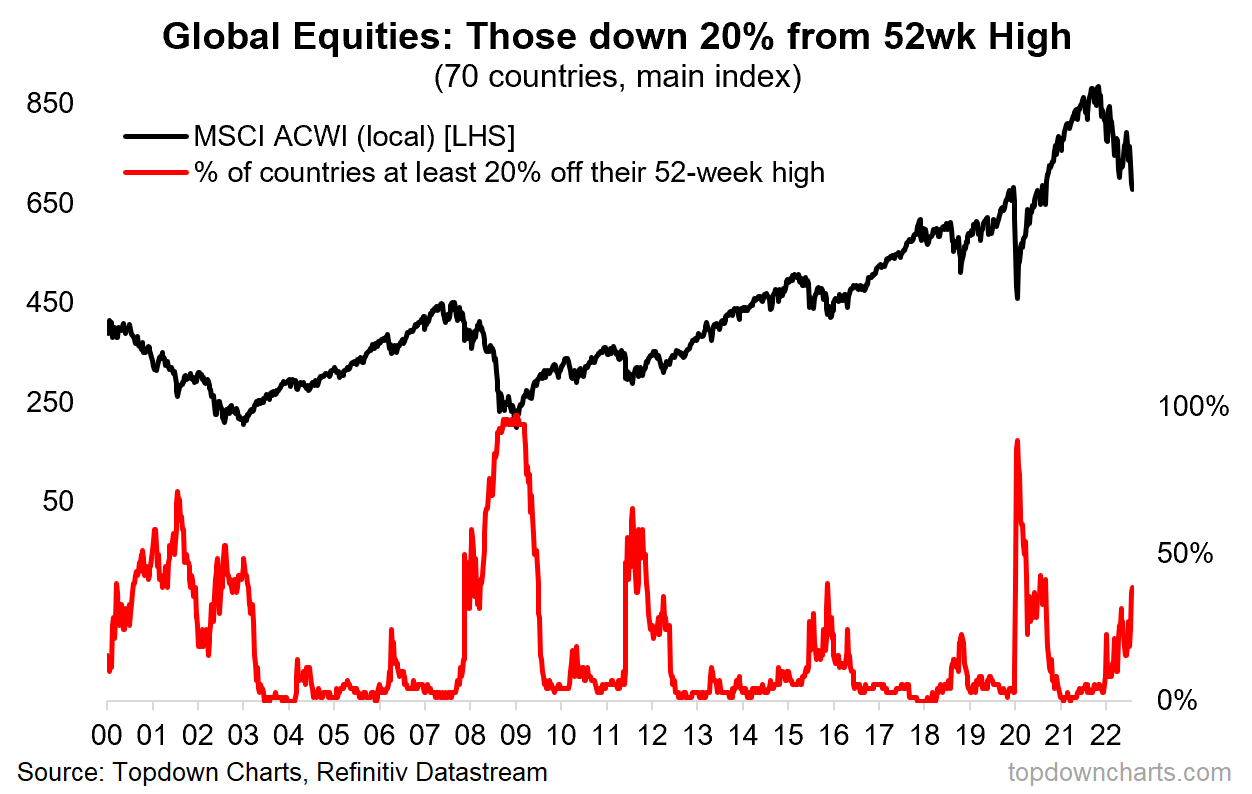
Bearmarketometer: using the popular media definition of a bear market as the stockmarket being down more than 20% — at this point 40% of the world’s stockmarkets are in an “official bearmarket“.
As regular readers will know I don’t really like that arbitrary percent change definition, I think bear markets are more of a process than a percent change …and depend on shifts in underlying business and financial cycles.
But it is still an interesting breadth indicator, which can be useful in generating technical analysis insights (e.g. if indicator is rising/falling, reaching extremes).
But as for real bear markets, in the context of slowing global growth, global monetary policy tightening, and correcting of previous extremes in valuations, sentiment and positioning, the current backdrop is very much consistent with what characterizes a global equity bear market.
And therein lies the clues for the next steps. To pivot from bear market to bull market, all of those things need to come full circle. Valuations need to get cheap, economy goes into recession and central banks start easing in response, positioning and sentiment get washed out, and technicals ultimately start to turn up.
Well, that’s the textbook setup or idealized framework. But certainly something to think about as the global equity bear market process progresses.
—
Best regards,
Callum Thomas
My research firm, Topdown Charts, has a NEW entry-level service, which is designed to distill some of the ideas/themes/charts from the institutional research service to provide the same high quality insights at a more accessible price.
Give it a try and let me know what you think! :-)
For more details on the service check out this recent post which highlights: What you get with the service; Performance of the service; and importantly: What our clients say about it…


as always.. great selection and information!
That IPO chart gives me the chill 😱😱😱