


Weekly S&P500 ChartStorm - 2 July 2023
This week: monthly charts, technical check, H1 vs H2 stats, AI hype, Nasdaq macro-fundamentals, small vs large, Fed cycles, secular stocks, sentiment shifts...

Welcome to the latest Weekly S&P500 #ChartStorm!
Learnings and conclusions from this week’s charts:
The S&P500 closed up +6.5% in June, its 4th consecutive monthly gain.
YTD it close up +15.9%, and historically strength in H1 tends to echo into H2 (albeit with some notable exceptions).
Although the Nasdaq far outperformed the S&P500 this year, it has been driven entirely by AI hype (with various macro-fundamental warning signs showing).
Record high household allocations to equities (in 2021) warns of a potential “lost decade“ (big trading range) for the stock market.
Both big and small investors alike are changing their mind on markets.
Overall, technically the market looks solid. If you knew nothing about neither AI hype nor murky macro narratives, you’d probably be going with the flow (which for now is clearly up and to the right).
1. Happy New Month! Another month, another move higher — the S&P500 up +6.5% on the month (the 4th monthly gain in a row), +15.9% YTD, and +24.4% off the October low, and now 6-months in a row closing above its 10-month moving average. There’s still 7.8% to go to the upside until it matches the all-time high from the turn of the year in 2022. But very clearly a solid run already.
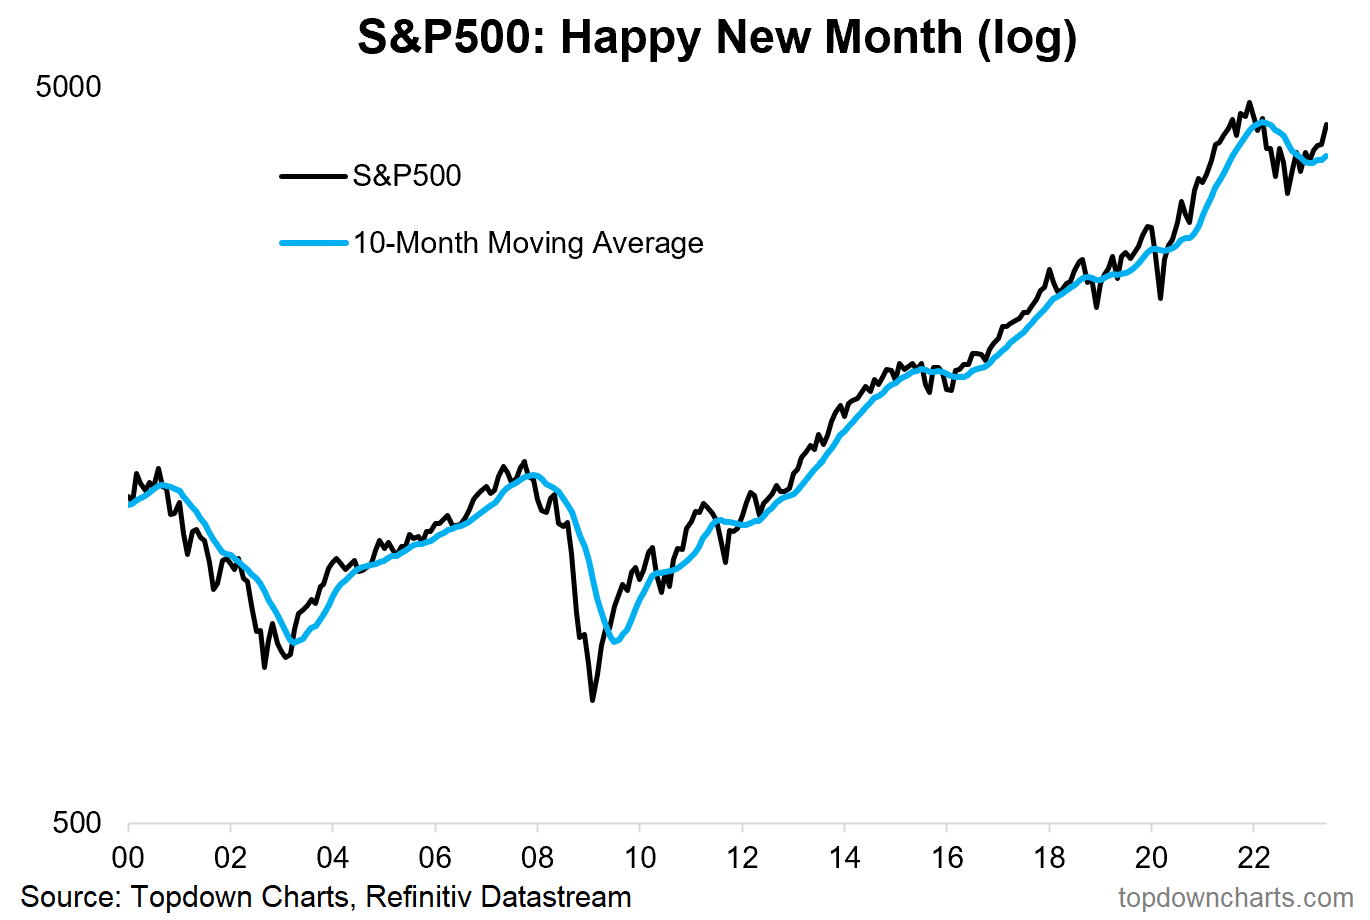
Source: @topdowncharts
2. Technical Check: This one’s interesting because not only did we end up clearing the lower resistance line, and then go on to break the upper line, but now in fact its gone on to retest that breakout and even chalked up a new high. So again, just on technicals, without knowing anything else, that looks bullish.

Source: @topdowncharts
3. 1-up on H2? Here’s the historical perspective on how markets have traded in the second half of the year following a 10%+ gain in H1. Hint: it’s mostly positive, albeit with numerous exceptions, and a couple of particularly notorious exceptions!
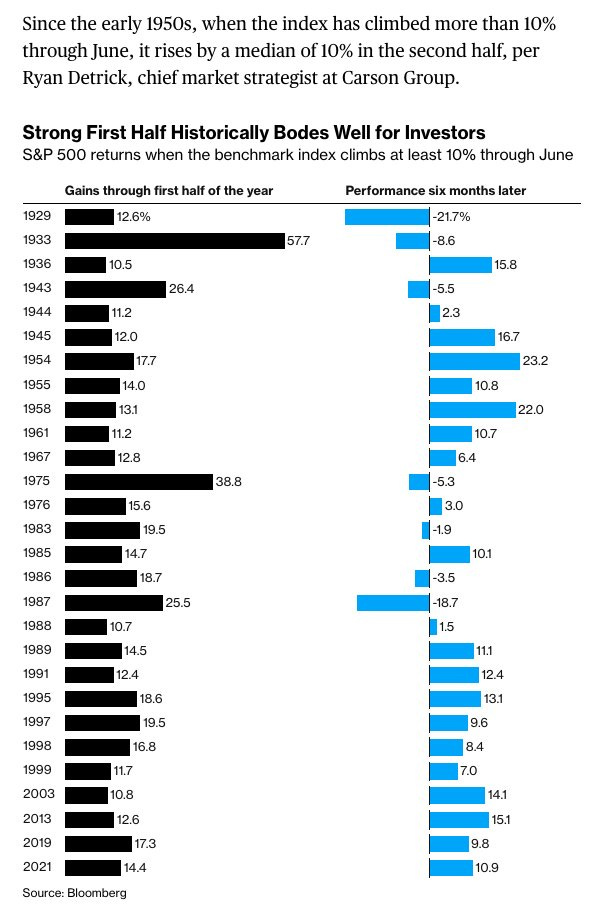
Source: @SamRo
@RyanDetrick4. All Well And Good: So if we take October 2022 as the low, while the headline market cap weighted S&P500 has done decent (+24%) the equal-weighted version has way undershot (+17%) (and Nasdaq way overshot (+41%), more on that in a minute), but it’s also undershot vs previous and typical bear market recoveries. Bull market for some, bore market for others.
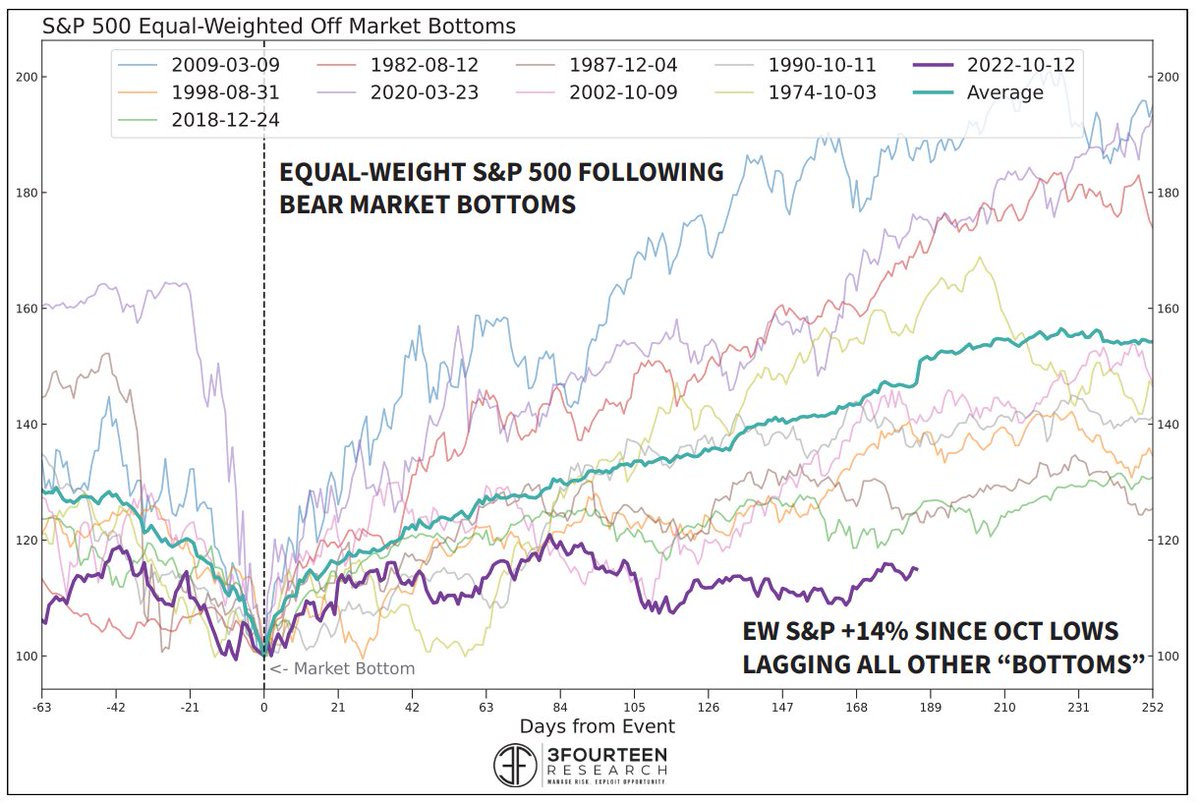
Source: @WarrenPies
5. The 800-pound Gorilla: Just as 2020 was all about the pandemic, 2023 seems to be all about the AI tipping point — with NVDA 0.00%↑ being the proverbial gorilla. It has spurred Jim Reid of Deutsche Bank to quip what we’re all thinking: "I’ll be totally honest that I’ve absolutely no idea how to value Nvidia." And when mania takes hold there is no telling how far things can go.

Source:
6. What About the Rest of Tech? It really is just a case of big tech carrying the market, if we look at the percentage of Nasdaq stocks with negative earnings, it has just reached a new all-time high. If you argue that it is a fundamental driven rally, it ain’t showing up in the numbers (at least not yet?).
Keep reading with a 7-day free trial
Subscribe to The Weekly ChartStorm to keep reading this post and get 7 days of free access to the full post archives.