
Weekly S&P500 ChartStorm - 2 April 2023
This week: technical check, seasonality, small and micro caps, tech stocks, financial conditions, the monetary wall, pivot possibilities, 200-day moving average, and GICS changes...

Welcome to the latest Weekly S&P500 #ChartStorm!
Learnings and conclusions from this week’s charts:
The market has ticked another box for bulls by recapturing its short-term uptrend line (along with retesting the breakout vs downtrend line and failed breakdown vs its 200-day moving average).
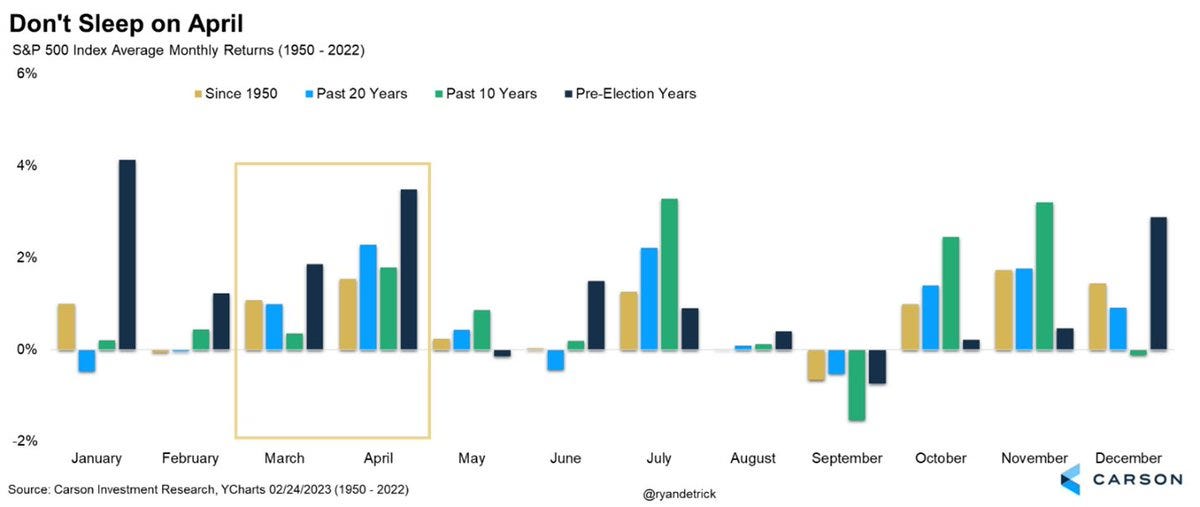
Seasonality is historically excellent in April (one of the best months for stocks).
Small & Micro cap stocks are so far holding onto key support levels (big for bulls in that a breakdown would have confirmed bear market: but still a big ol’ trading range to clear).
The sustainability or otherwise of any new bull is going to depend bigly on whether the market can clear the incoming monetary tightening wall.
The March GICS changes have shuffled a few more stocks out of the Tech sector and into a new category within Financials (payments).
Overall, the resilience of the market in the face of various threats and headwinds is something to pay attention to, and in the short-term it looks like the bulls are in control. But as noted below, when debating bull vs bear market, a reminder is due that neither (aka trading range) is also an option!
ALERT: in case you missed it, I just published the Q1 update to the “10 Charts to Watch in 2023“ (macro-market outlook and risks/opportunities ahead).
1. Trends vs Ranges: We’re not quite ready to retire that chart… last week the index managed to close back above that nascent uptrend line — and this comes after retesting that downtrend line and a failed breakdown vs the 200-day moving average. But don’t get too excited just yet: there is still the matter of overhead resistance to deal with (~4200), and again, it’s worth pondering: when everyone is asking “bull market or bear market?“ — “neither“ (i.e. range trade) is always an option.

Source: Topdown Charts @TopdownCharts
2. April Rules: Something to keep in mind — historically April has on average been one of the best months of the year. So a breakout vs resistance has seasonality in its favor.
Source: @RyanDetrick
3. Tech Test: A key driver of the rebound in stocks since The Great Bank Run Crisis of 2023 (sarcasm) has been tech stocks. There has been a rapid rotation across sectors (well, basically Tech surging on lower yields and QE/pivot narratives… and financials plunging), this has placed the Nasdaq 100 vs S&P 500 relative performance line at a key juncture — brushing up against a major overhead resistance point (former support). This is going to be a useful simple rule in terms of market regimes: a breakout means back to business for tech stocks, while a failure to launch will be more in line with the tech unwind bear scenario.

Source: @the_chart_life
4. Macro-Test for Micro-Caps: Another corner of the markets facing a key test is the micro-cap microcosm. If it is going to be a new bull market then these guys need to hold support and ideally rally (and ideally get out of the trading range rut). Equally, if it truly is a bear market then bears would want to see support get taken out.
