Weekly S&P500 ChartStorm - 19 March 2023
This week: technicals check, bank stocks, global equities, cash, yield curve, valuations, margins, macro, CDS pricing, credit spreads outlook...
In this week’s Weekly S&P500 #ChartStorm we look at the risk outlook for the S&P500, bank stocks, and global equities in general (main takeaway: mostly bad, with a few key trigger points to watch closely). Also touch upon lofty valuations, squeezing margins, widening credit spreads, and the macro outlook…
1. Triggered: While the S&P500 has made a couple attempts at reclaiming its 200-day moving average, more and more individual stocks are losing it — triggered initially by speculation about a Fed pivot (back to 50bp hikes), and then of course the banking sector issues…
Source: @MarketCharts
2. Bank Stocks Take the L: I quipped on Twitter, that the regulatory bargain of bank bailouts has been changed — depositors get saved, stockholders get shaved. As such, bank stocks arguably should now trade at a permanently (or at least cyclically) lower valuation. Meanwhile, regional bank stocks have further air to fill between here and support. And by the way, markets actually don’t always go down and then V back up, more often they drop and then mess around for a while (particularly in fundamental-driven downturns).
Source: Topdown Charts @TopdownCharts
3. Financial Sector: Zooming out on financial sector stocks, this one I would say is one of the most important charts to keep tabs on — if that key support line goes it’s going to take the whole market down with it.
Source: @Honeystocks1
4. Global Banking Sector on the Precipice: Same thing for global banks — yes the regional bank crisis is mostly a US thing, but the issues that face the banking sector right now are global (inflation + rates shock, property markets correcting from excessive valuations, and global recession incoming). Again, if this support line goes then so to do global equities in general.
Source: Topdown Charts @TopdownCharts
5. Global Equities on the Edge: And speaking of global equities, after a valiant attempt at getting back to bull, global equities have failed from intermediate overhead resistance, the breadth rebound has failed, and now a major support line looks to be in the process of getting taken out. As I mentioned to clients with this chart, global equity technicals were already looking tenuous… and with the banking sector issues the market just found an excuse/catalyst.
Source: Topdown Charts Professional @TopdownCharts
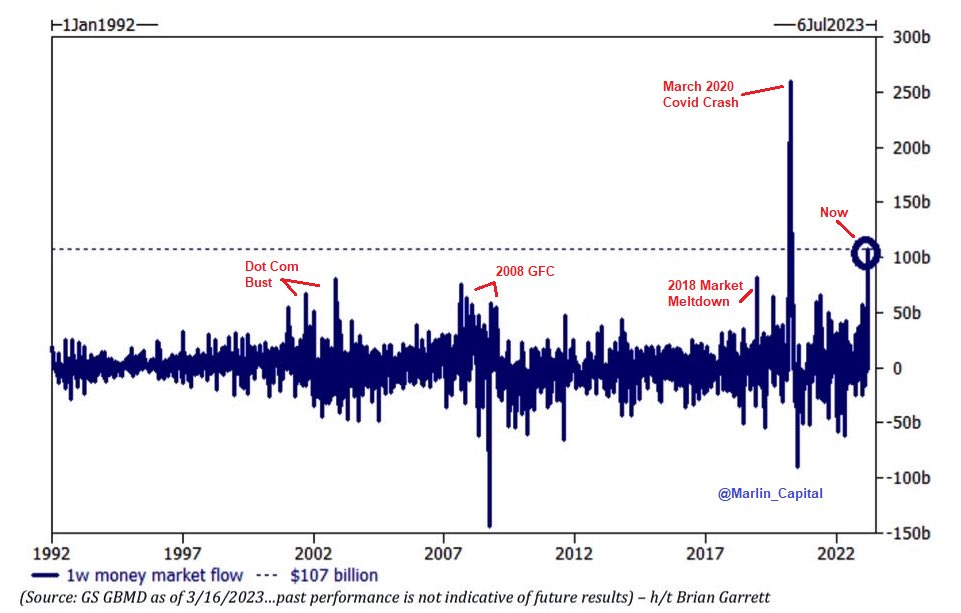
6. Dash for Cash: Given all that’s going on in markets and macro… and perhaps more to the point, given the relatively attractive yields on money market funds, we have seen a dash for cash. Why take risk in equities when you can get 4-5% risk free in cash (not to mention the implicit option value in holding cash).
Source: @Marlin_Capital via Daily Chartbook
7. Yield: The yield curve says yield.
Source: @sstrazza
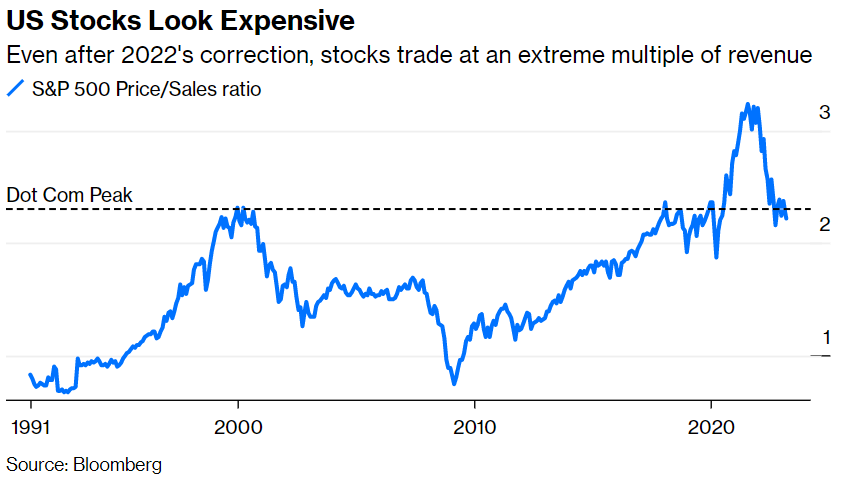
8. The Valuation Plateau: As I noted in the Chart Of The Week last week, US equities (although undertaking a fairly material reset) remain lofty/expensive relative to recent history. Permanently higher plateau or preposterous profligacy?
Source: @johnauthers
9. Margin Pressure: To make matters worse for charts like the one above, the outlook for profit margins is not good (and this is especially important for price to sales ratios). Rising labor cost pressures, rising rates, banking sector issues, recession risk… these are things that result in lower earnings margins (and lower earnings).
Source: The Dangerous Assumption Embedded In Today’s P/E Ratios
10. So you want to Pivot? Firstly, it is worth clarifying; the bank bailout is not QE. It is an ostensibly wise move from policymakers in terms of avoiding doom spirals, but it is not net-easing nor a pivot in policy stance. Secondly, for all the pivot expectors, the question and dilemma is: can/will/should the Fed pivot to rate cuts when inflation is still high (albeit likely heading lower)? There is no recent historical precedent for it… but if things took a hard left and a deflationary recession kicked in, that’s likely a slamdunk case for pivoting …but something in between? That’s going to be a judgement call for the Fed on the shifting evidence they have at hand as this whole thing unfolds.
Source: NewEdge @CameronDawson
Thanks for reading, I appreciate your support! Please feel welcome to share this with friends and colleagues — referrals are most welcome :-)
Also, in case you have yet to subscribe (or upgrade to paid), a remindoor:
BONUS CHART >> got to include a goody for the goodies who subscribed.
Tech-Bank Credit Omen: tech troubles and banking blowups may well just be the first stages in a larger credit default cycle. Certainly the market mood has changed notably on credit risk in the bank + tech sectors relative to recent years.
Not to be too much of a hindsight hero, but ultimately credit is/was on borrowed time. It’s quite normal that when you get a sharp/extended period of policy tightening that you get casualties, and credit is often in the firing line.
Everyone loves inflation targeting monetary policy when inflation is too low, but enthusiasm tends to wane on inflation targeting monetary policy when inflation is too high. Monetary policy fair weather friends no more.
—
Best regards,
Callum Thomas


Great charts. Add the chart of FRC. Beware of buying on chart support points during a crisis. FRC shows this risk as investors have failed to find fgd bottom. They know the bottom price could be close to zero if the bank fails. Equity holders take the first loss. JPM bought Bears Stearns for $2 a share and Lehman fell to 15 cents a share ( where I sold my 1000 shares). Cheers
Love the big picture given by these charts.