
Weekly S&P500 ChartStorm - 19 February 2023
This week: margin debt deleveraging, sentiment vs positioning, bear market rally, target divergence, recession-less, macro factors, bond flows, new highs, venture bubble burst, effective tax rates...

Welcome to the Weekly S&P500 #ChartStorm — a selection of 10 (+1) charts which I hand pick from around the web and post exclusively on Substack.
These charts focus on the S&P500 (US equities), and the forces and factors that influence the outlook - with the aim of bringing insight and perspective.
For more background, see: ChartStorm Origin Story
1. Margin Debt Deleveraging: The just-released January margin debt data continued to show a picture of deleveraging, but clearly slightly less-so as the rally gave hope to hodlers. One interesting point is how similar the red line looks to the early-2000’s.

Source: Topdown Charts @TopdownCharts
2. Sentiment vs Positioning: I first featured this chart early last year when sentiment was collapsing but positioning held steady. Since then positioning has come down somewhat, but as of recently it’s sentiment that has done the most work to close the gap by rebounding. Was it all just a case of bearish hysteria?

Source: Topdown Charts @TopdownCharts
3. BMR: Speaking of bearishness, the latest BofA fund manager survey shows that most professional investors still see the current rebound as a bear market rally.
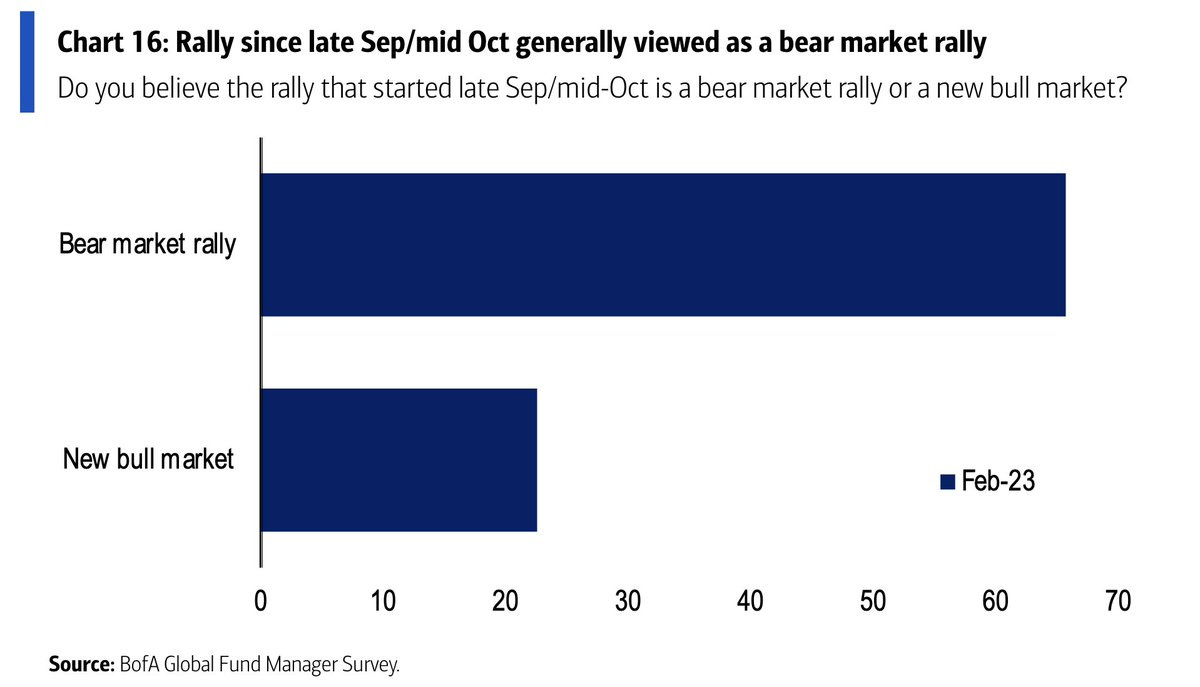
Source: @RyanDetrick
4. Strategists Squabble: The next chart shows how the gap between the most bullish vs bearish strategists has grown to the widest on record. Whatever happens from here, some (or many) are going to end up very wrong…
