Weekly S&P500 ChartStorm - 18 August 2024
This week: technical check, cash off the sidelines, professional skepticism, market vs the economy, Fed and J-Hole, big vs expensive, allocations, bubble history, gold...
Welcome to the latest Weekly S&P500 #ChartStorm!
Learnings and conclusions from this week’s charts:
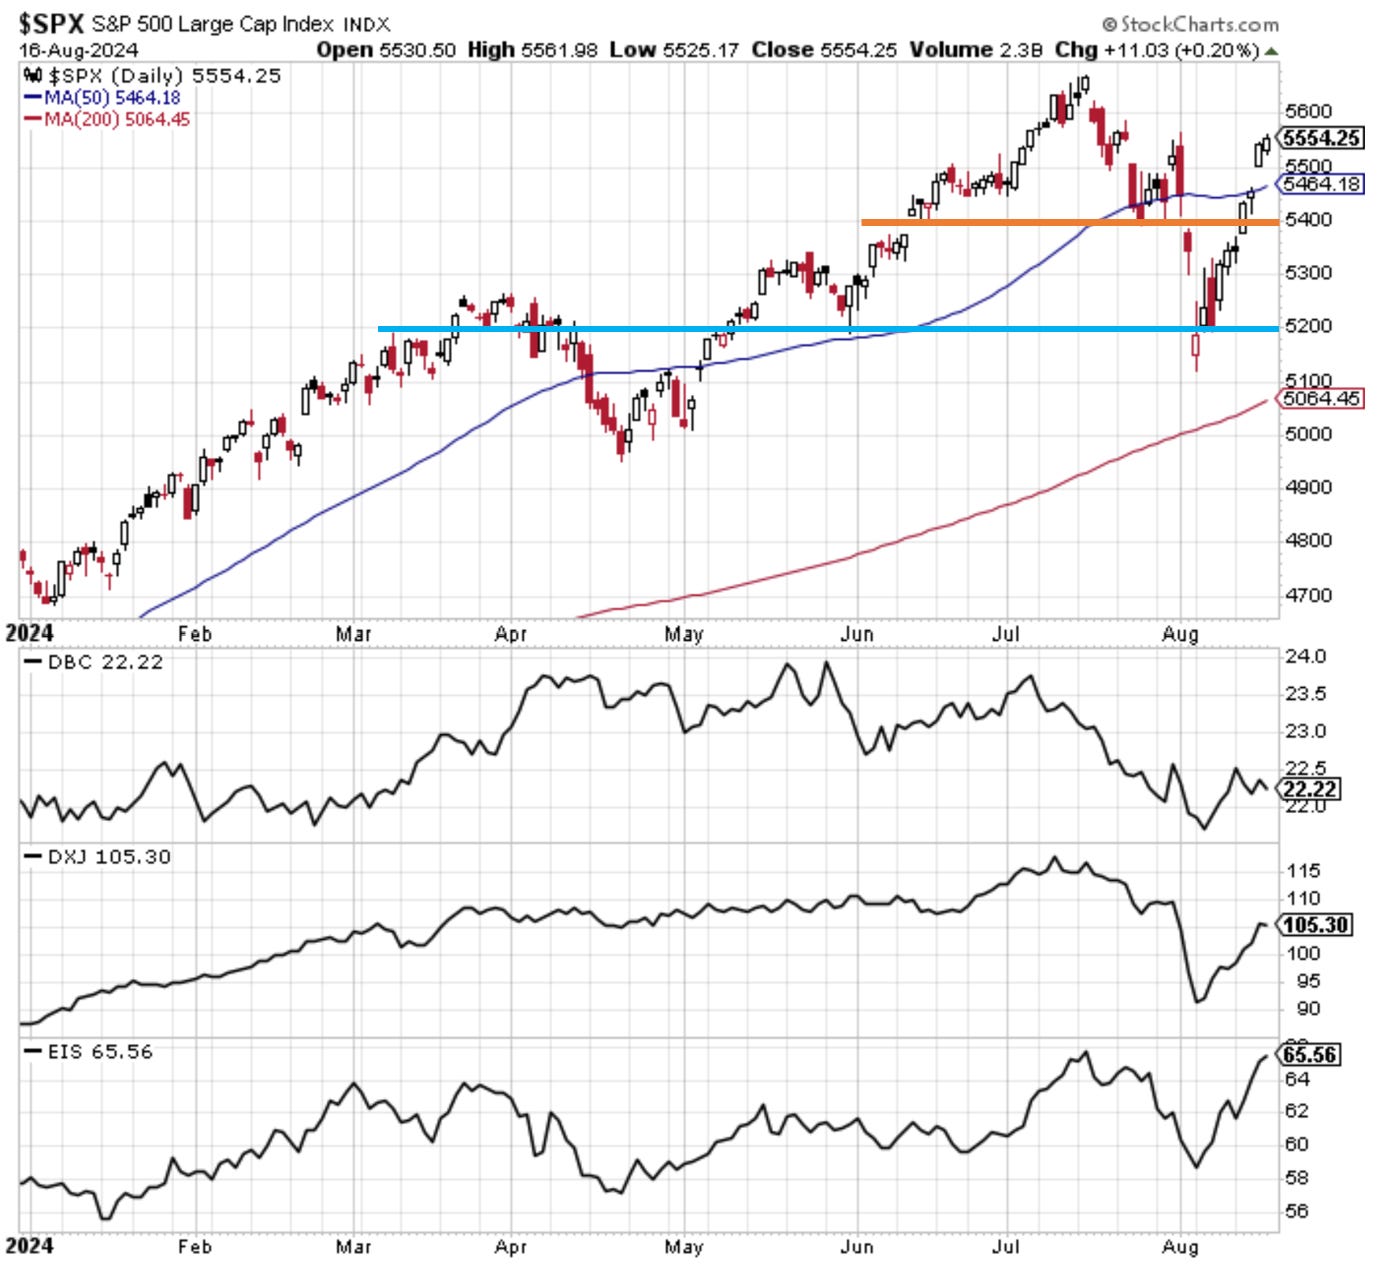
The S&P 500 has reclaimed key technical territories.
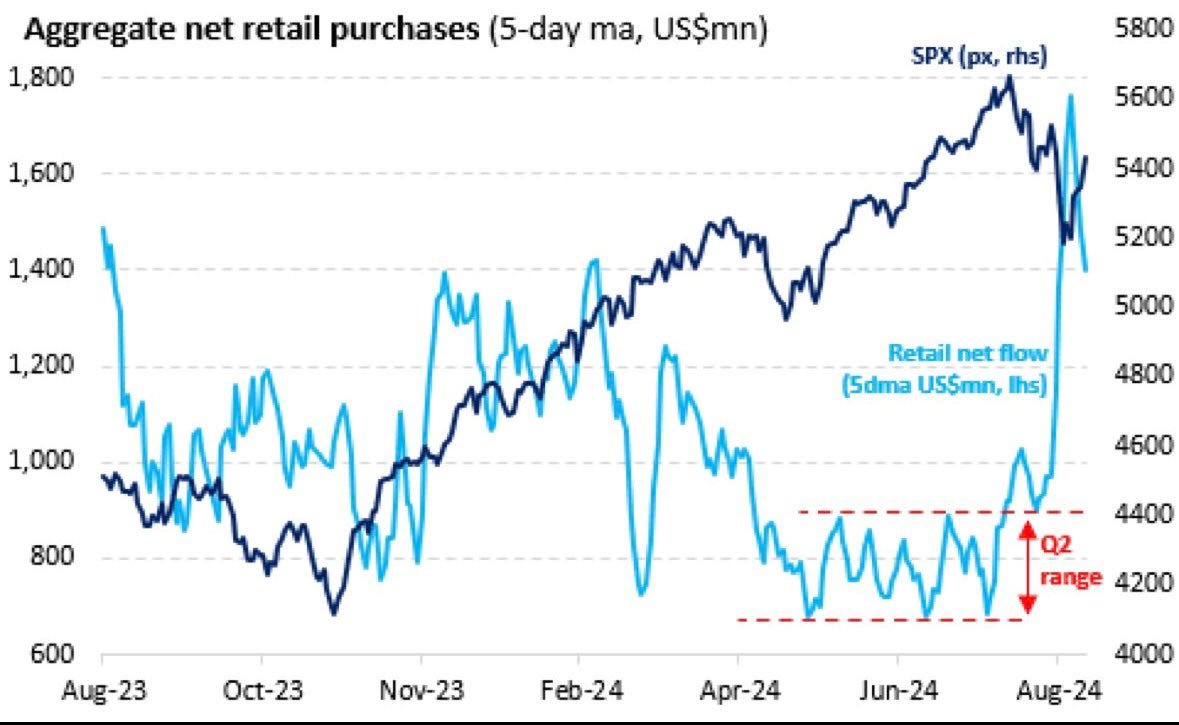
Retail cash left the sidelines with massive dip-buying.
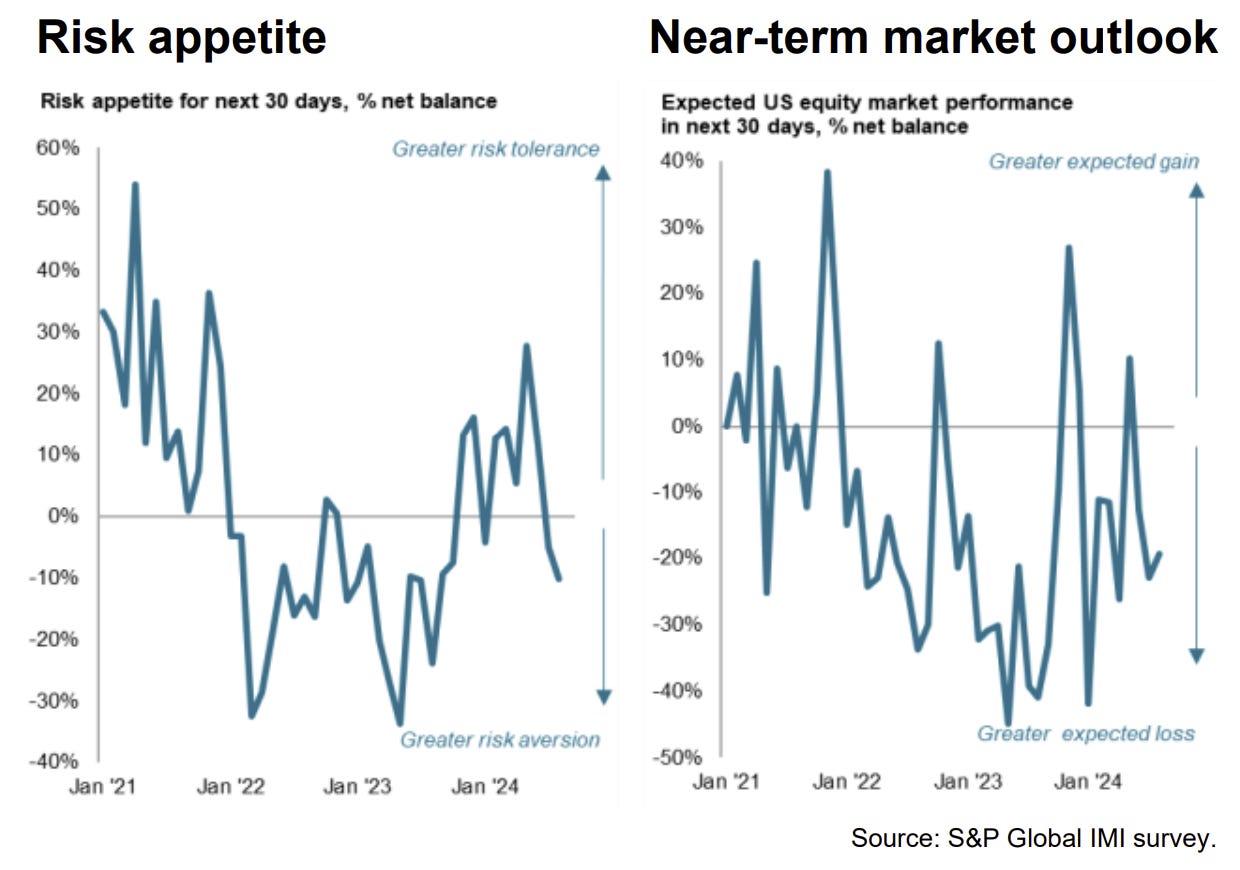
Investment Managers remain skeptical however.
Some of the biggest risks are also the biggest upsides.
Investor allocations to equities are at cycle highs.
Overall, at the risk of sounding overly bullish at the wrong possible time, things are looking up — the technicals have clearly improved and some of the “boogeymen” seem a little less scary at this point. To be sure several key risks remain and we are still late-cycle, but with rate cuts on the way, technicals turning up, and nothing happening… maybe it is just that simple.
1. Safe and Sound: After a failed break below 5200 and recapture of 5400 (+the 50-day moving average), the S&P 500 sure looks to be on a more solid footing. The simple absence of new bad news has been enough; the Japan thing went away as quickly as it came, Middle East geopolitics are taking a turn toward calm, and as far as recession risk goes… there’s no new bad news, but equally it’s probably going to take more time and data to get more clarity on that front.
Source: Callum Thomas using StockCharts.com
2. Back in the Pool: Meanwhile, a major tailwind has been massive buying by retail. Turns out there really was cash on the sidelines. Fascinating if this really did turn out to be the archetypal “healthy correction”.
Source: @DonMiami3
3. Professional Skeptics: On the other hand, investment managers remain skeptical. They cite valuations, macro, and (geo)politics as the key reasons for caution. This maps to a couple of surveys I recently ran on LinkedIn + Twitter/X — they showed folk are most concerned or bearish about Geopolitics (most likely centered on Iran/Israel war risk, but also Ukraine taking territory in Russia), and Recession risk. Ironically, that makes geopolitics and recession risk a major potential upside risk… i.e. if simply nothing happens.
Source: Investment Manager Index
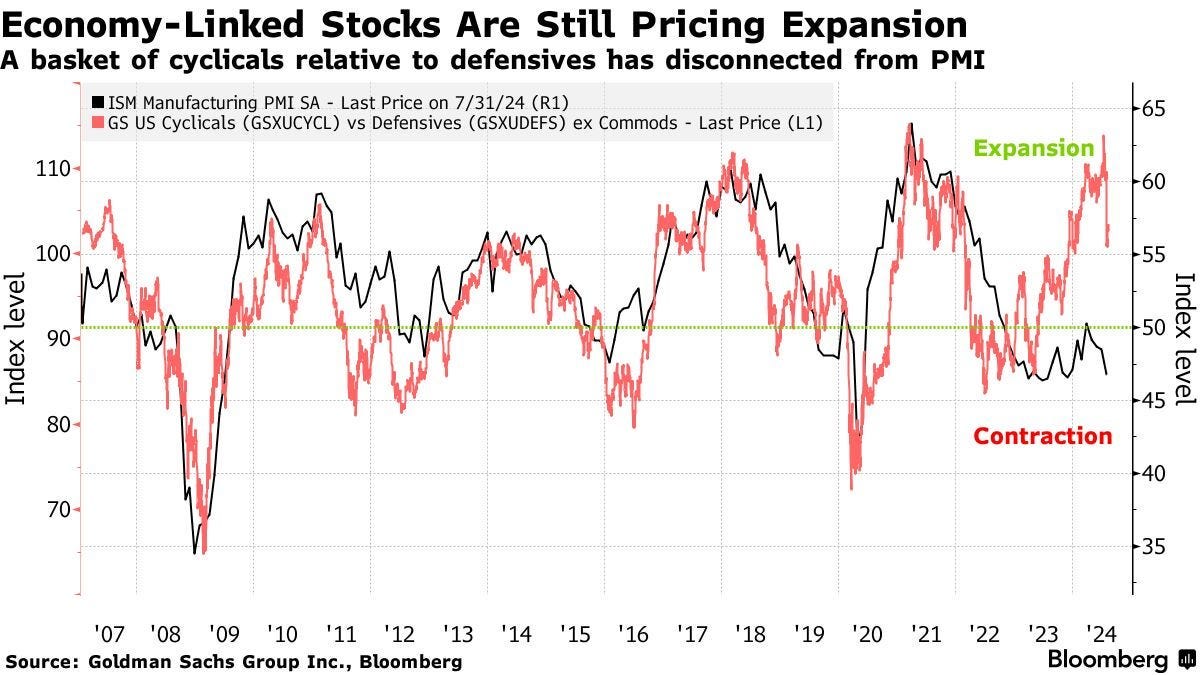
4. What Recession: While the PMI is bouncing along the bottom (after a short-lived attempt at reaccelerating), US cyclicals vs defensives are trading as if it’s boom times. It probably says as much about the market psychology (bullish fervor) as it does economic psychology (mixed feelings).
Source: Bloomberg - What Panic?
5. Wall Street vs Main Street: Indeed, if we look at economic sentiment vs investor sentiment, the gap remains large. Investors are highly bullish even with the Augbust, while economic sentiment is consistent with recessionary conditions. Again, I think there is some truth to the black line — namely, in real terms people don’t feel like they are getting ahead given inflation, and the k-shaped economy where there has been recessionary sectors/regions/individuals as the rising rate and cost-shock environment has seen winners and losers.
Interestingly I would say this chart speaks to both upside risk in terms of the potential for the black line to catch-up (likely expressed in cyclical rotation)… but also, if people are this crabby now, just imagine what it would look like if a real recession takes hold.
Source: Topdown Charts Professional
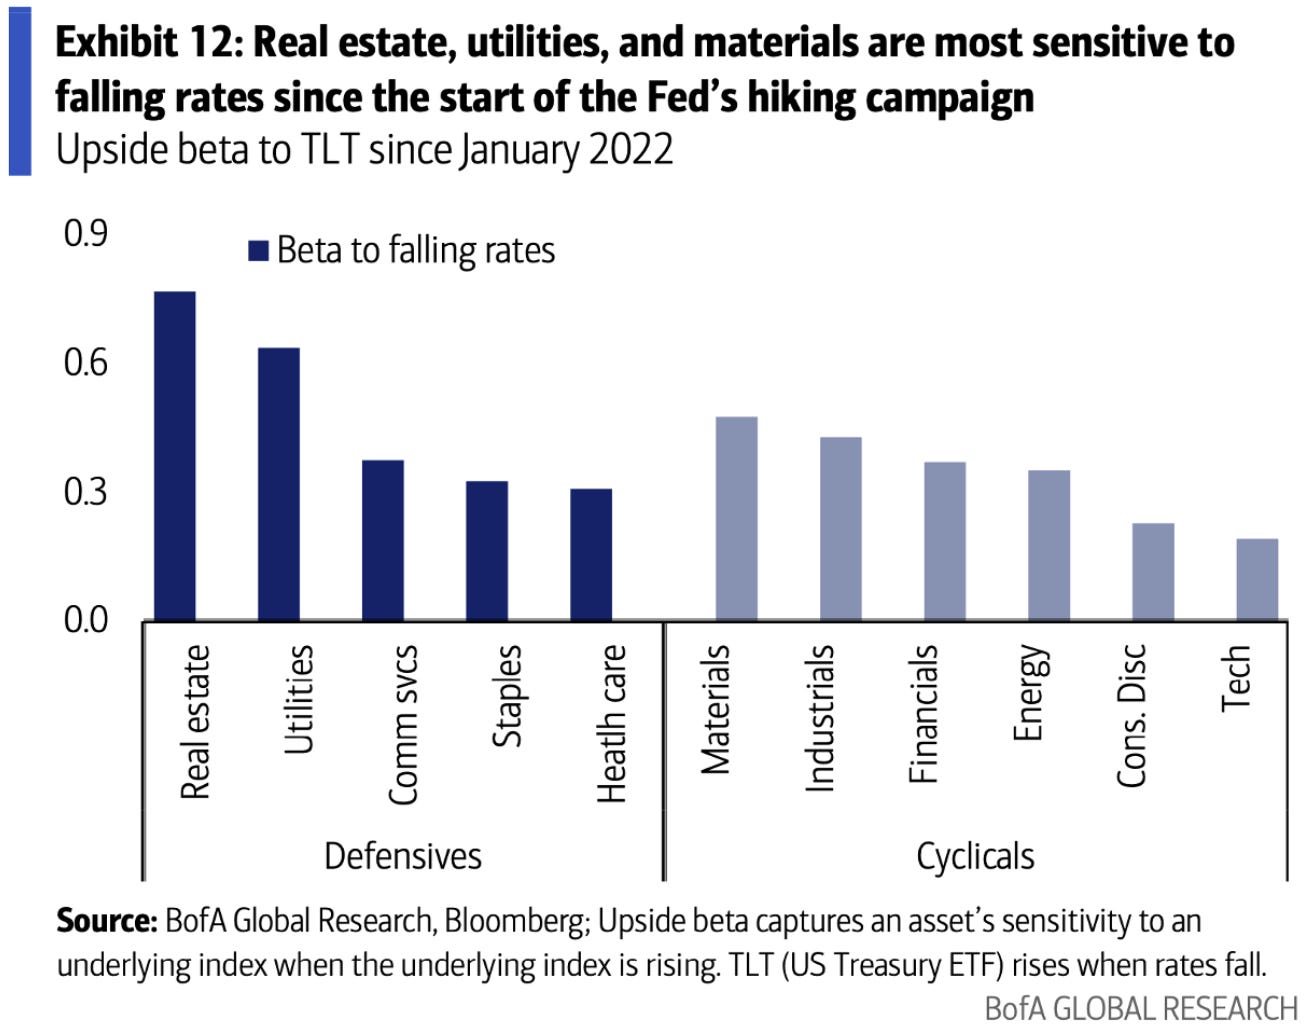
6. Jackson Hole: Also helping markets along is rate-cut speculation — on that note, next Friday J-Powell speaks at J-Hole (on the economic outlook) and odds are he will look to prep things for a rate cut. As noted last week, rate cuts with no recession = good (rate cuts with recession = bad). But also note the relative winners in falling rates — namely REITs, Utilities, Materials(likely driven by gold miners). I think those are probably decent defensives anyway, so whether nice or nasty rate cuts, those sectors are probably going to be good bets should rates head lower.
Source: Daily Chartbook
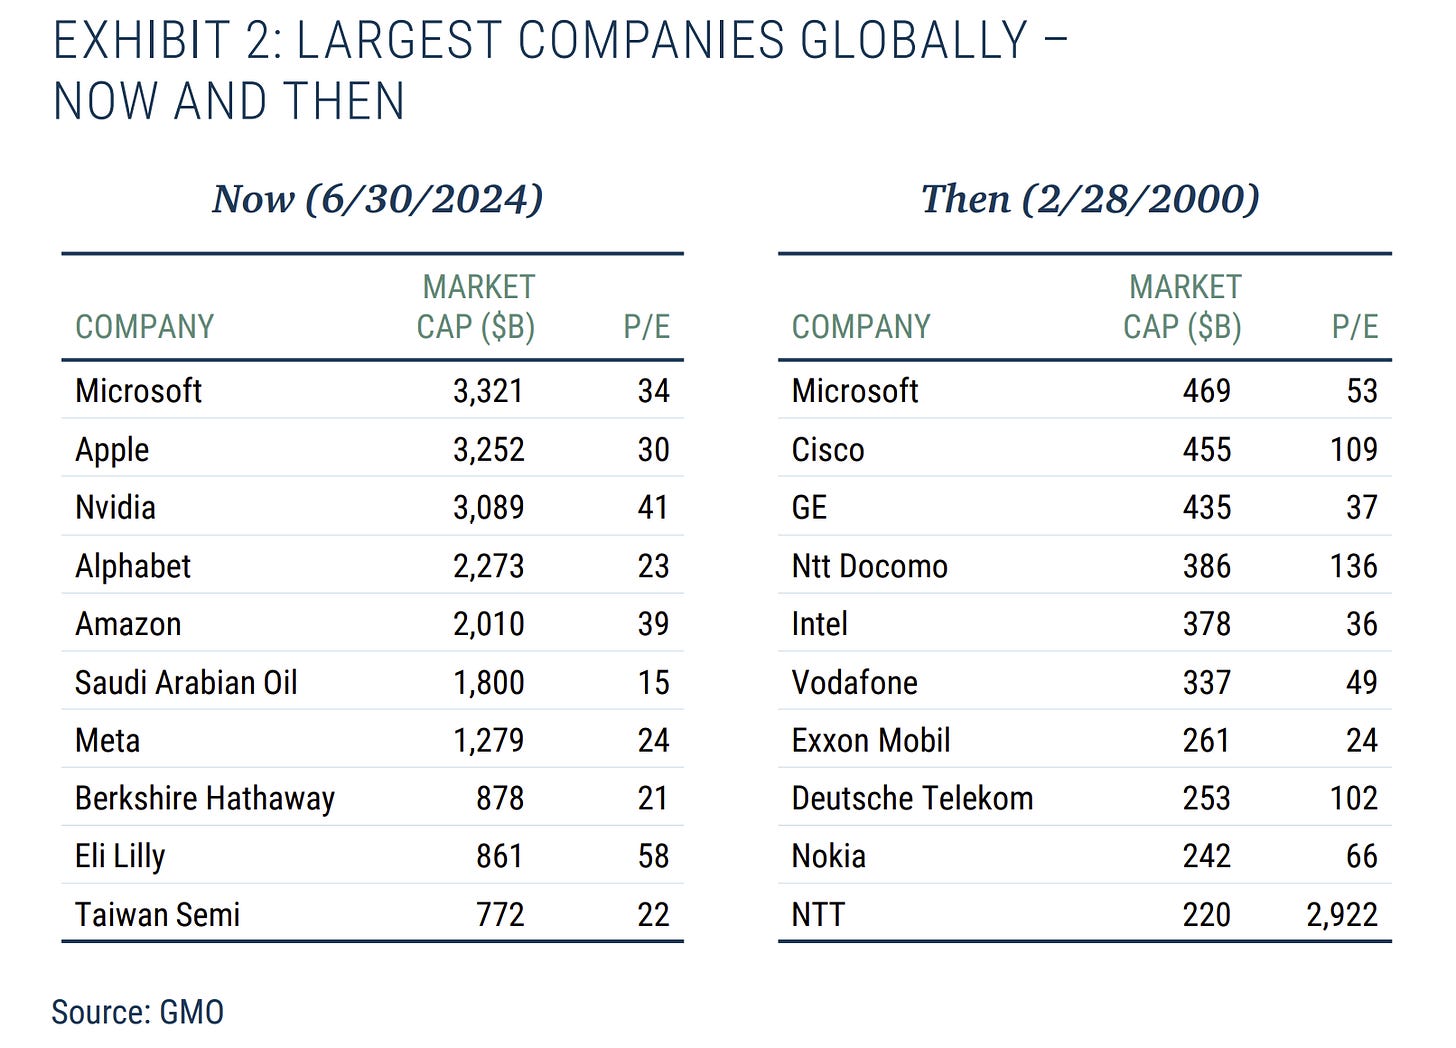
7. Bigness Bubble vs Valuation Bubble? Interesting comparison of the biggest stocks now vs during the dot com bubble. It definitely is different this time, there’s obviously more earnings, more tech, more mature and real companies doing real things, and so-on. But you might argue, while back then the P/E ratios were insane and represented the bubble… maybe this time it’s a bubble of concentration vs valuation (which by the way is not to say things are cheap, tech stocks are the most expensive they have been outside the dot com bubble!).
Source: GMO - Concentrate!
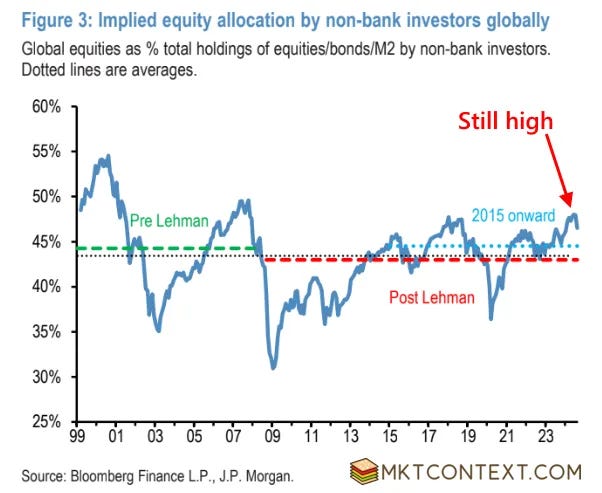
8. Equity Allocations: Implied equity allocations by non-bank investors globally are still at cyclical highs. Have they been higher before? Yes. Could they go higher from here? Yes. And either way, is medium-term downside risk higher when we’re at these kind of levels? Also Yes.
Source: MktContext
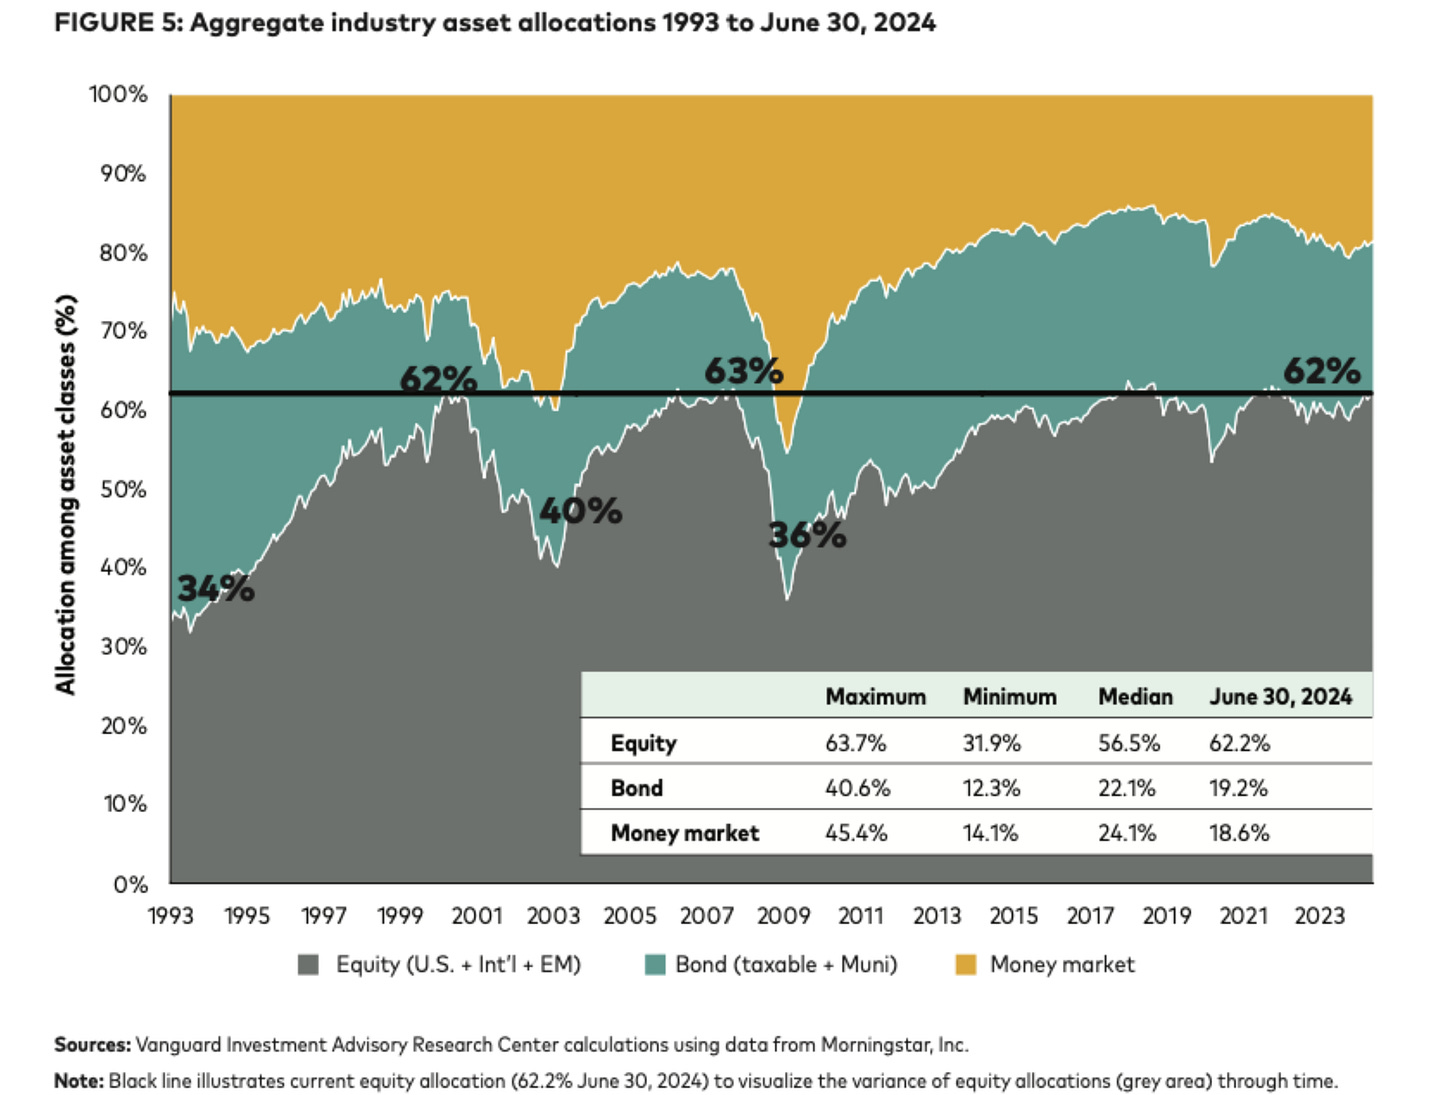
9. Whichever way you cut it: And another version of it — this one for the USA and using aggregated assets across the investment industry. No matter which way you cut it, the data is clear — investors have filled their boots with equities.
Source: @MebFaber
10. History Hijinks: This one is not necessarily a comment on current times, but more of a reflection on history and human psychology. Bubbles are a constant through history because humans are a constant through history. We will have more bubbles in the future and people will probably behave more or less the same way every time. We can of course as individuals at least try to learn from history… both in terms of not getting run over trying to prick the top of the bubble and going against it too early, but also in not throwing caution to the wind and staying alert to the risks — ideally forming tools and strategies to help navigate the thing and come out ahead.
Source: The Fifth Person
Thanks for reading, I appreciate your support! Please feel welcome to share this with friends and colleagues — referrals are most welcome :-)
BONUS CHART >> got to include a goody for the goodies who subscribed.
Gold + Gold Miners: a little off topic, but interesting to note gold breaking higher from its recent 4-5 month consolidation round the highs..


