Weekly S&P500 ChartStorm - 17 September 2023
This week: US vs global tech, large vs small, hedge fund tech flows, equity risk premium, valuations, tax take, retail flows, earnings turning, cash on the balance sheet, cash on the side....
Welcome to the latest Weekly S&P500 #ChartStorm!
Learnings and conclusions from this week’s charts:
US tech has substantially outperformed global tech, and US large caps have reached long-cycle highs of outperformance vs small caps.
Hedge funds are crowding into tech stocks just as one measure of the tech stock equity risk premium has gone negative.
US equity valuations have reached a new higher plateau.
US corporate earnings growth is turning up after a soft landing, and this may trigger firms to deploy cash on the balance sheet to capex.
The surge in money market funds may be bullish for stocks (but not just yet, based on how past cycles of fund flows have unfolded).
Overall, there is ample evidence that the long secular bull market in US (large tech) stocks is looking mature/extended/at-risk. But despite all we can (and should) learn from history, the books are still being written and these trends and cycles can go on for longer than you expect. There will eventually be a turning point, and there will be definitely clues to that turning point, and I will be watching those clues for you!
1. USA vs the World: It’s no secret how far and fast tech stocks have gone, but one thing some might have missed is how decisively US tech stocks have outperformed those of the rest of the world. As such they now trade at a major valuation premium (US tech stocks trade at about a 2-3x premium on my numbers). And in the age of increasing dominance of passive investing globally, it becomes self-reinforcing as global and domestic flows increasingly go to the largest market cap stocks.
Source: Chart of the Week - US Tech Supremacy Topdown Charts
2. Large vs Small: A similar thing going on here — this time looking at US large vs small, with large caps absolutely crushing small caps over a 20-year return window. One thing that stands out in this chart is a clear tendency for cycles and giveback e.g. the last time when US large caps outperformed small caps on this scale, there was a long period of giveback where smalls outperformed large. While there are indeed big structural changes underway, it’s important not to forget the cycle.
Source: @JeffWeniger
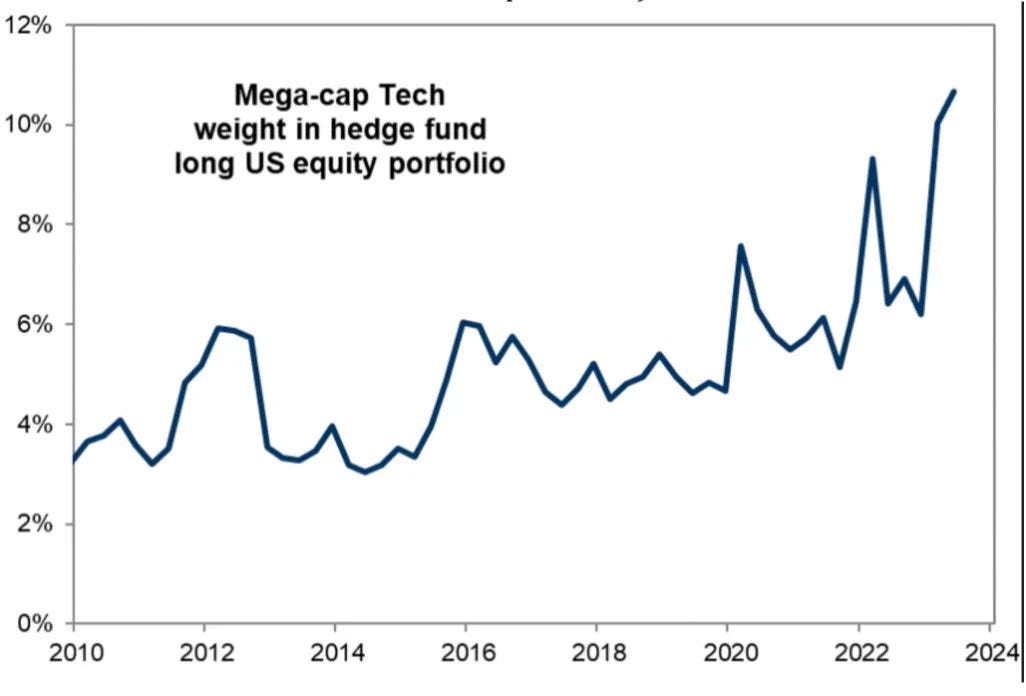
3. Hedge Funds are all-in on Tech: You might say they are piling into tech because that’s where the best opportunities are, but a slightly more cynical take is that in hedge fund land it pays to run with the crowd and ride the momentum bandwagon.
Source: @dailychartbook
4. No Risk Premium, no Problem? This chart shows the “prospective earnings yield on the Nasdaq 100 adjusted for the Federal Reserve’s benchmark rate” — basically investors are so confident in US tech stocks that they no longer require a premium for taking on equity risk over and above just taking the risk free rate on cash.
Source: Bloomberg via ZeroHedge
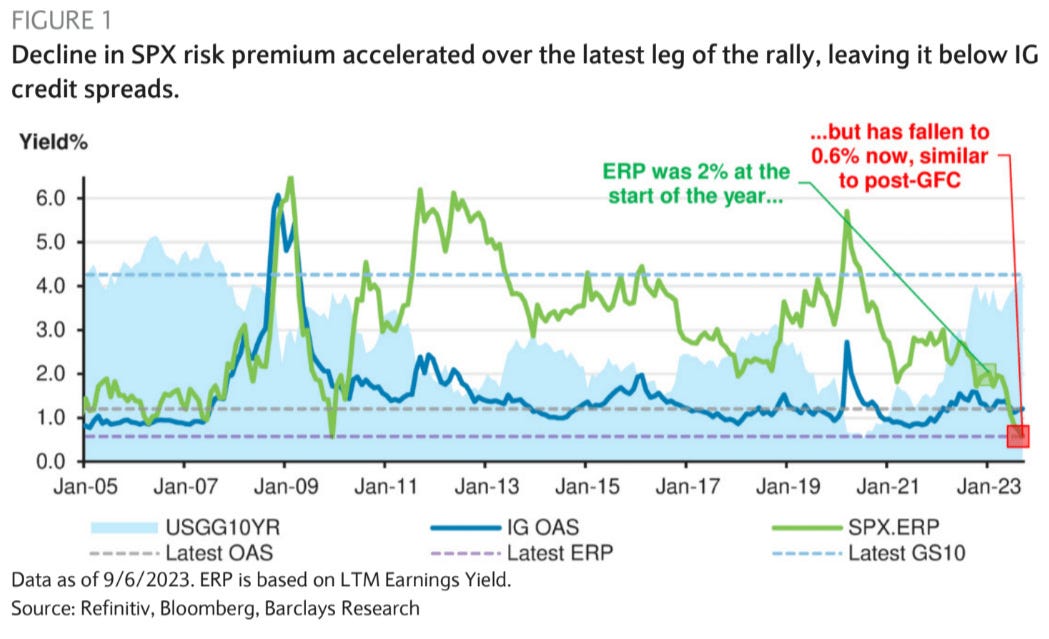
5. Equity Risk Premium vs Credit Spreads: And here we have another version of the Equity Risk Premium (ERP) [and yes, there are multiple different versions of the ERP, but the main concept is to gauge the level of compensation for taking on equity risk vs just investing in cash/bonds] — this time for the S&P 500, and this time comparing vs credit spreads. While this is not apples-to-apples, basically you could say investors feel more confident in taking on equity risk vs credit risk (but even then, current credit risk premium is relatively low).
Source: Daily Chartbook
6. Valuations in Perspective: Across a number of different metrics, US equity valuations have reached a new higher plateau. Previously the argument was that cash rates are low, so it is justified (but then cash rates have now gone up a lot). Another argument is that it’s fine or irrelevant because sector composition changes across time (but you actually reach a similar conclusion even after adjustign for sector changes). One quite interesting point is that typical investor allocations to equities is now a lot higher than in the past, and that is an important aspect — we saw investor allocations pretty much double from the 1980’s… this could be thought of as driving a one-off re-rating higher. Probably also means that investor allocations to equities will need to stay high to sustain this structurally higher level of valuations.
Source: ASR via Bloomberg
7. Economy-wide Effective Tax Rate: Seems like the more you take in tax, the less the stock market gives back in terms of returns. Now there’s no doubt a cyclical self-stabilizing factor in play here (economy goes down, tax goes down), but it is logical that if you actively take more in tax (and spend it dumbly — which lets face it, most governments around the world have a habit of doing) then at the very least confidence will take a hit, and at worst if you end up contracting fiscal policy then you lean against the economy (and earnings, etc). Probably an important chart and concept to keep tabs on as government expense bases balloon in the world of higher for longer interest rates.
Source: @McClellanOsc
8. Pay Up: Not sure if this apparent relationship will hold going forward (but it does make sense) — chart shows student loan payments vs retail buying of stocks [inverted] …basically the implication is that the resumption of student loan payments (after the previous pandemic/stimulus related pause) will mean less discretionary cash, and therefore less retail flows into stocks (and most likely also will be a headwind for alternative assets, crypto, etc).
Source: @vandaresearch via ZeroHedge
9. Earnings Inflection Point: Judging by the path of the PMI, the earnings recession looks to be at a turning point (US corporate earnings took a hit in 2022/23 as margins contracted, mostly due to cost pressures). This is a piece of good news — one way to deal with expensive valuations is to grow earnings enough to justify it or at least make up for less return-tailwinds from multiple-expansion…


