Weekly S&P500 ChartStorm - 17 December 2023
This week: technical check, sentiment, All-in on AI, bank stocks, buybacks, options trading, Fed funds foibles, mag-7 revenue geography, margin debt deleveraging...
Welcome to the latest Weekly S&P500 #ChartStorm!
Learnings and conclusions from this week’s charts:
This week saw an upside breakout and expanding breadth.
We also saw a near-record reading of overbought signals (but this may be a feature rather than a bug).
Sentiment continues to shift to the upside.
Buybacks and banks have contributed to the rally.
Margin debt deleveraging has continued apace.
Overall, the bull run off the October low by all technical accounts looks healthy and strong, fueled by bullish capitulation, shifting sentiment, and a combination of perceived and actual improvement in the macro/policy backdrop. Yet there are a few notable causes to keep one foot out the door…
Podcast: I recently sat down with Geoff Castle (Lead Portfolio Manager of Pender’s Fixed Income portfolios) to discuss my work at Topdown Charts — reflections on macro and markets in 2023, framework and process, outlook for treasuries, small caps, commodities, corporate bonds, and emerging markets… an interesting and enjoyable conversation, well worth a listen! —> [link to podcast]
1. Breakout: As noted last week, on the technicals — this is a very bullish market. A failed breakdown, upward sloping 200dma, expanding breadth, and now an upside breakout. Only thing left to tick-off now is a new all-time-high, which in all odds will probably be chalked up before the year is out unless anything comes out of left field to derail things.
Source: @Callum_Thomas using Market Charts
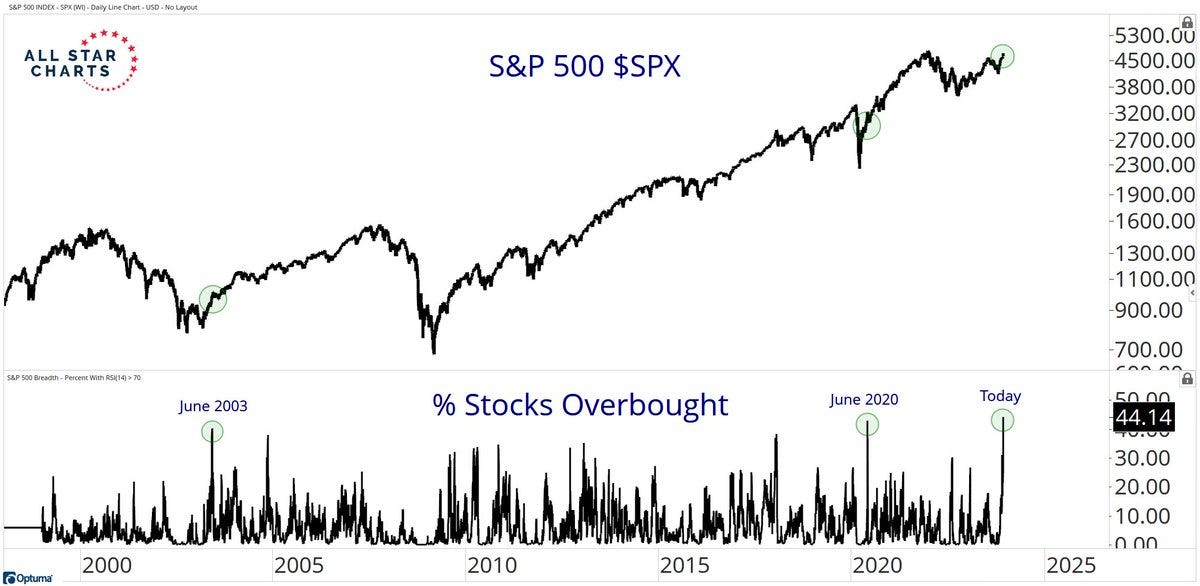
2. Overbought? The proportion of stocks showing up as “overbought” (in this case an RSI reading greater than 70) has reached one of the highest levels in recent decades. This does make the market vulnerable to short-term consolidation, but it is important to emphasize that an overbought signal is often times actually bullish early in the move as it signifies strong momentum. Overbought signals at the end of a prolonged move on the other hand tend to be bearish as it signifies mania, hype, and excess optimism. So if you consider the recent bull run as starting off the late-October low then this is arguably a bullish signal.
Source: @sstrazza
3. Risk-On: The latest Investment Manager Index showed investment managers reporting increased risk appetite through November. Respondents basically reported the reasons as “mission accomplished” on Fed rate hikes (peak in rates and prospective pivot), less of a drag from politics and fiscal, and declaration of soft-landing (with recession risk now off the table as far as most people are concerned). No doubt some of this is overdone in terms of the optimism upsurge, but for now these improved perceptions on the macro backdrop are carrying stocks higher.
Source: Investment Manager Index
4. All-in on AI: Speculators have been stampeding into tech stocks. The combination of AI hype, passive flows favoring the big end of town, and the prospect of peak rates has powered up speculative fervor.
Source: @MPelletierCIO
5. Banks Back: Another bullish development has been the breakout by regional banks to a 6-month high after bouncing off the lows and putting in a bullish RSI divergence. And indeed, the perceptions around a less restrictive Fed, lower perceived recession risk (credit risk), and the demonstrated Fed put for banking stress earlier this year are among the forces driving the turnaround here.
Keep reading with a 7-day free trial
Subscribe to The Weekly ChartStorm to keep reading this post and get 7 days of free access to the full post archives.


