
Weekly S&P500 ChartStorm - 17 April 2022
This week: risk-driver review, check on tech, retail investor sentiment, the hidden bear market, utility of utilities, agribusiness on the moove, muddy macro, asset valuations...

Welcome to the Weekly S&P500 #ChartStorm. The Chart Storm is a selection of 10 macro/market charts which I hand pick from around the web and post on Twitter.
The charts focus on the S&P500 (US equities); and the various forces and factors that influence the outlook - with the aim of bringing insight and perspective.
Hope you enjoy!
This week’s edition is Sponsored by: Capital Market Laboratories
Thousands of hours of expert research, One-on-One CEO interviews, an auditor verified track record, all condensed into 20 Top Stock Picks -- why go it alone? Join CML Pro Today
1. Correction-Drivers Update:
-EPOL [Poland ETF] (geopolitics proxy): at a stalemate for now
-LQD [IG Credit ETF] (credit/rates): new lows as bond yields spike further
-ARKK [New Tech Fund] (tech burst): drifting further lower
Market itself just resting at support (and below both the 50 & 200dma).

Source: @Callum_Thomas
2. Amazon vs Commodities… Cycle has shifted: unfriendly regime for tech.

Source: @exposurerisk
3. The rise and rise of tech... Permanently higher plateau?
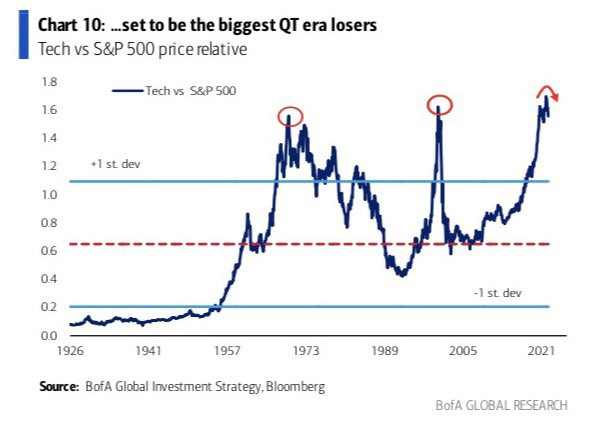
Source: @Marlin_Capital
4. Retail Investor Sentiment: Decent correction in sentiment as measured by this indicator, but it’s still quite far from the bottom end of the range.

Source: TD Ameritrade Investor Movement Index
5. The hidden bear market... The headline index itself has not been much to get excited about either way, but under the surface there is a tell-tale sign of weakness and basically for all intents and purposes a hidden bear market.

Source: @WillieDelwiche
6. Utilities: Turns out Utilities... have utility in a down market.
(and extra informative that they are outperforming while bond yields are surging)
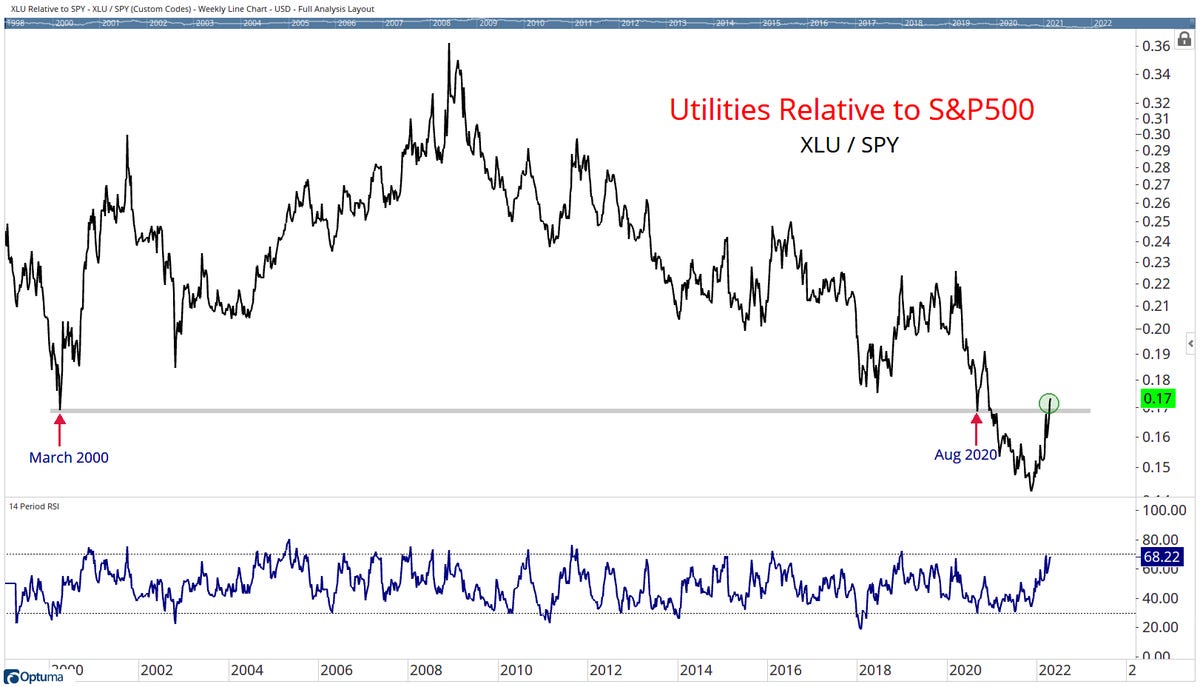
Source: @honeystocks1
7. Agribusiness on the moove: Agribusiness ETF breaking out vs the S&P500 after an extended period of chewing its cud, so to say.
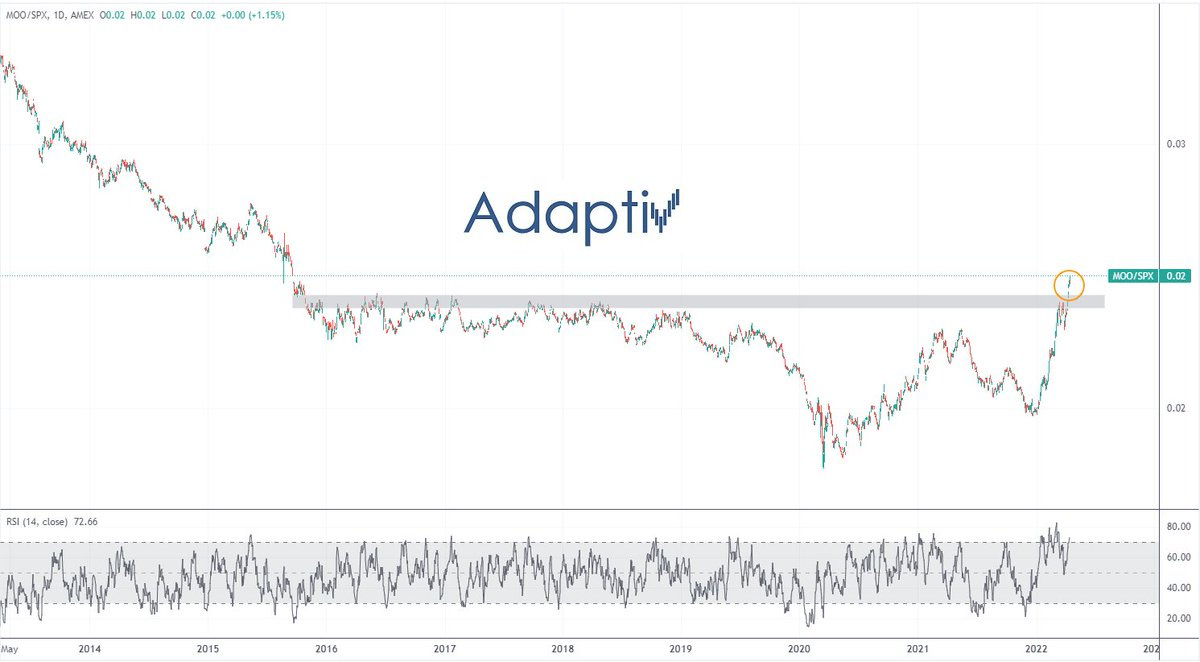
Source: @AdaptivCharts
8. Supply/Cost Problems: The supposably transitory problems of supply chain disruption/shortages/covid/rising costs is still to this day very clearly a major problem for business, based on what companies are saying during their earnings calls.

Source: FactSet via @PriapusIQ
9. Economic Forecaster: The famous and clever Economist, Dr S&P500, is forecasting a slump in the ISM manufacturing PMI.

Source: @t1alpha
10. Asset Valuations: Commodities the least dirty shirt?

Source: @topdowncharts from The 12 Charts to Watch in 2022 [Q2 Update]
BONUS CHART >> got to include a goody for the goodies who subscribed.
Cyclicals vs Defensives: US cyclicals vs defensives have pushed deeper into new lows. Similarly, the gradual decline for EAFE has accelerated, and EM appear to have put in a lower high. All-up, around the world, cyclicals vs defensives have gone from a source of strength to a source of weakness.

And when you zoom out at the global level it looks very clear: this is not a bullish chart. At best maybe markets go sideways, but this is not a situation where the macro/value backdrop is at best (expensive valuations, high inflation, stumbling growth, tightening monetary policy).

We’ve just been through a period of historical excess, and as the tides come in, so do they go out. Sorry if this is too bearish for you, but I just look at the charts and say what I see. When they facts change, my opinion will change.
—
Best regards,
Callum Thomas
My research firm, Topdown Charts, has a new entry-level Substack service, which is designed to distill some of the key ideas and themes from the institutional research service to provide the same high quality insights at a more accessible price.
Give it a try and let me know what you think
Moo - who knew? (Didn’t know about that ETF, thus not it’s performance)
Thank you for that and (as always) your weekly view.
Watching “the tides” from Canada, chi-miigwech, Alan
I always find at least one thing from your Chartstorms that I'm going to put on a watchlist or save as a bookmark. This time it was the MOO ETF.