Weekly S&P500 ChartStorm - 16 April 2023
This week: volatility trends, Zweig breadth thrust, CNBC trigger, bull traps vs bear taps, investment managers, earnings recession, Fed pauses, ERP, European equities, value vs growth, positioning...
Welcome to the latest Weekly S&P500 #ChartStorm!
Learnings and conclusions from this week’s charts:
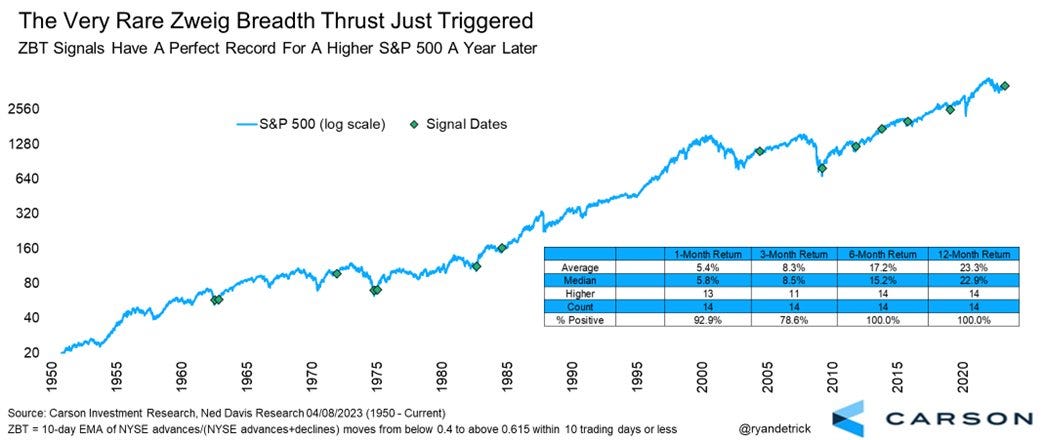
Add “Zweig Breadth Thrust“ and “downside volatility count“ signals to the growing list of bullish price-related signals for stocks.
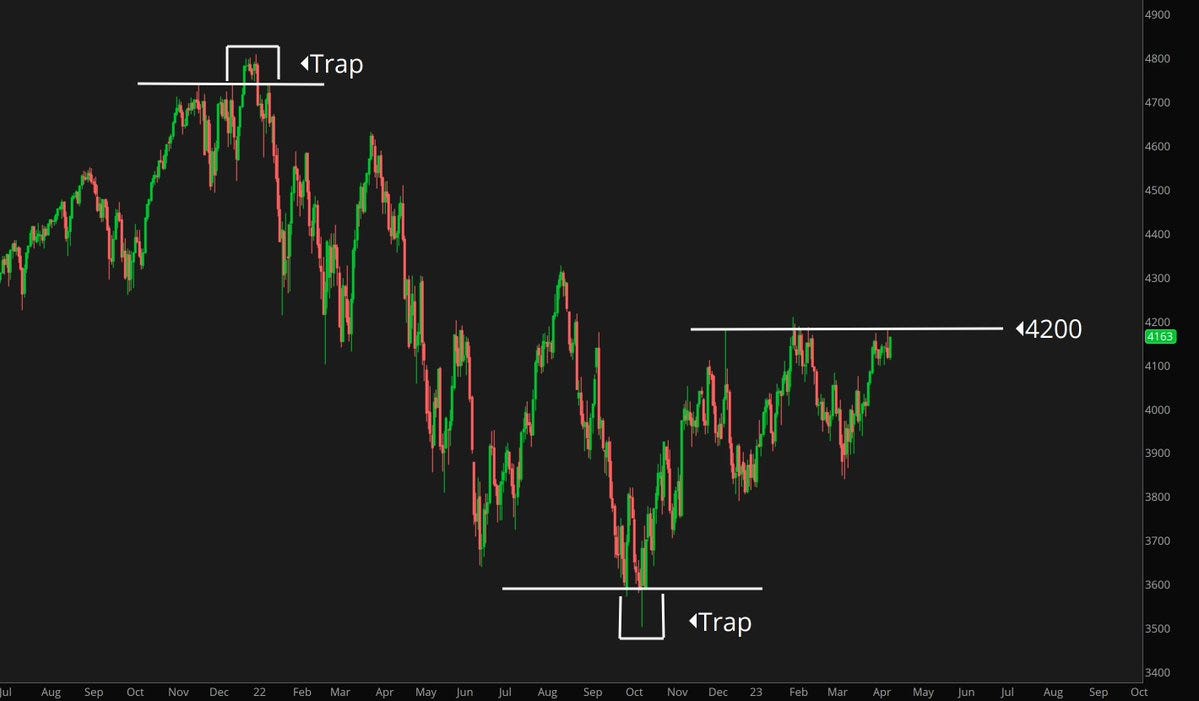
Reminder that a breakout for the S&P500 through 4200 could just as easily end up being a bull trap vs a “bear tap“ (don’t get too caught up in levels).
Investment managers are getting more bearish (based on fundamentals).
For instance, we are basically in the middle of an earnings recession, the equity risk premium is at the low end of the range, and a prospective Fed pause could easily be bearish stocks based on the longer-term history.
Elsewhere, European equities have seen earnings breakout to a new all time high, and have seen a surge in buyback yield (now on par with US equities).
Overall, the sum of the charts this week echoed the theme that showed up in my weekly surveys — “bullish technicals, (but) bearish fundamentals“. To state the obvious: this resolves by either the price picture breaking down to meet the bad fundamentals, or the fundamentals turning to support the price. Anyway, check out the charts and see for yourself — questions/thoughts welcome in the comments section.
1. Alt Vol Signal: Ok, so this one needs a bit of explaining; what it’s showing is the 12-month rolling daily count of days where the S&P500 dropped by at least -1%. Basically it’s an alternative view of market volatility (or specifically: downside volatility). The interesting thing about it, and why it’s interesting right now is that when this indicator surges and then peaks and turns down, that’s typically been a decent all-clear signal for the end of bear markets. Naturally there is a “but“ — this signal hasn’t always been clean & clear cut, in fact a good example of it being early is the false dawn in 2002. But it’s one to keep an eye on as a downtrend in this indicator is typically associated with smoother sailing.
Source: Topdown Charts @TopdownCharts
2. Zweig Breadth Thrust: Another constructive price-based signal (the definition is in the chart — and p.s. you can enlarge the charts by clicking on them). This signal is basically generated when you get a sharp lift in the proportion of stocks going up vs down from previous suppressed levels. Going only back to 1950 it has a perfect track-record on a 12-month forward returns window.
Source: @RyanDetrick
3. Markets in Turmoil? Good. Another intriguing bullish signal with an impeccable track record — whenever CNBC runs a “Markets in Turmoil“ Special, it’s basically been buying time. Pretty much your classic contrarian signal: ‘be greedy when others are fearful’ and all that.
Source: @charliebilello
4. Bull Trap or Bear Tap? But before you go getting all giddy about the bull case, beware of bull traps. A breakout through that critical 4200 level (if it actually comes, rather than just more of the same ranging), could just as easily end up being a bull trap (where it breaks out and then goes back on down) …as a bear tap (where bears tap-out and capitulate to the upside).
Source: @yuriymatso
5. Investment Manager Index: Risk appetite among professional investors has dropped back to early-2022 levels (recession concerns, bank sector issues, ongoing monetary tightening, heightened geopolitical risk). Indeed, astute readers will note that so far most of the bullish evidence has been price-based, while much of the bearish evidence is fundamental based…


