Weekly S&P500 ChartStorm - 15 October 2023
This week: waving the flag, consensus bears, flow season, defensives, stocks vs bonds, micro caps, valuations, rise of AI, gold miners vs energy stocks...
Welcome to the latest Weekly S&P500 #ChartStorm!
Learnings and conclusions from this week’s charts:
A potential (unconfirmed) “bull flag” pattern is forming.
Sentiment is moving to the bearish side, at a time just prior to a seasonal upshift in flows (year-end rally?).
Stocks look stretched vs bonds (both price and value).
Equity market valuations have been behaving unusually (different this time?).
Gold miners are cheaper than energy stocks.
Overall, there are some important “lines in the sand” forming for markets, with an interesting array of arguably bullish evidence for the short-term outlook, but meanwhile risks continue to build-up in the background.
1. Waving the Flag? Depending on your perspective this one is either (or a combination) of bulls waving the white flag… or the market waving a bull flag. (a classical charting continuation pattern). A “bull flag” is a downtrend channel within an uptrend that resolves to the upside. The psychology behind the move is that bulls remain optimistic throughout the corrective wave; buying up stocks on the dip to the low end of the trend channel, while bears double-down their selling at the top end of the channel. In that sense the resolution in the form of an upside breakout comes as bulls’ buying exhausts and overwhelms bears’ progressive waves of selling. BUT. Don’t get carried away on that idea until (and only *if*) it actually resolves to the upside. Unless it actually breaks out to the *upside* and confirms the pattern, it’s just a bearish trend channel (and p.s. it can break down too). But a useful decision rule and pair of lines in the sand… that no doubt just about everyone will be talking about soon!
Source: Callum Thomas using StockCharts
2. Consensus Bullearish: The Consensus Inc sentiment indicator has dropped below 50% for the first time in almost a year. While the sample window is limited, in recent history the odds have been in favor of the bulls when this happens (paradoxically at the precise moment when they start to lose confidence).
Source: @RenMacLLC
3. Fun Flows: This chart shows the seasonal pattern of fund flows, and November seems to be historically typically a bumper month. So maybe November is when things will come right.
Source: Daily Chartbook
4. Defensives in the Dump: Defensive Stocks (Staples, Health Care, Utilities) have taken an intensive beating. A big part of it has been the links the group have with bonds, especially utilities (and the latest bond bludgeoning), and it only adds to the relative declines the group has seen as the AI-hype bull bounce left them in the dust. I wonder if this is a contrarian signal for defensives… (and what does that mean if you find yourself bullish defensives?).
Source: @jasongoepfert
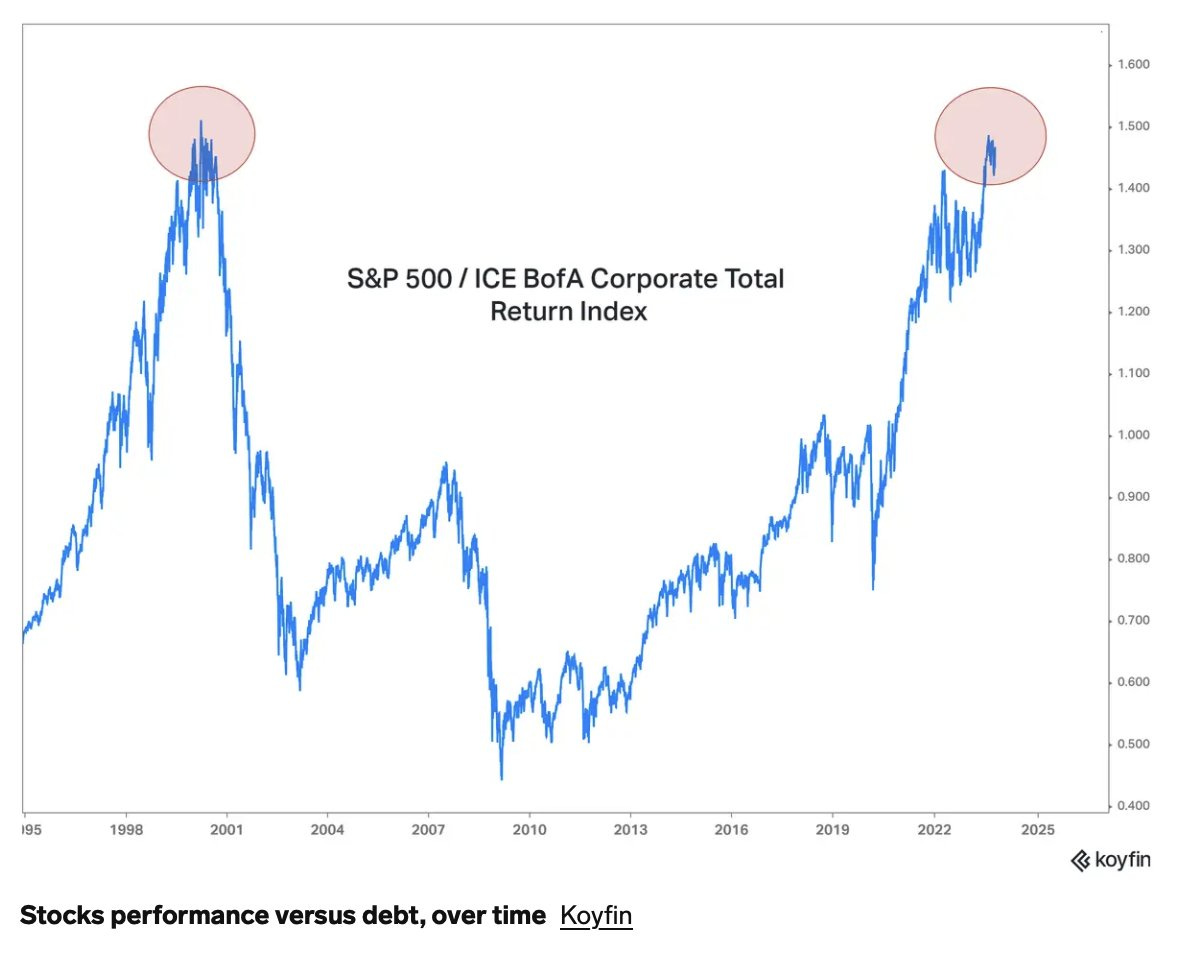
5. Stocks vs Bonds: Stocks have had an amazing run vs corporate bonds since the 2009 market bottom. You might say though that they only just got back to the dot-com high, and effectively had a lost 2-decades. As they say: entry point and path matter! Interesting also though to see it peaking out after a sharp run up — overbought at resistance?
Source: @Barchart
6. Stocks vs Bonds — Relative Value: Not just price, (and this one by the way is looking at total returns for stocks and *treasuries* on the black line) value is also looking stretched. Stocks are the most expensive vs bonds since the dot com bubble. You would need a repeat of dot-com for stocks to get more expensive vs bonds from here. But not only are stocks (S&P500 — larger caps, and especially tech) expensive vs bonds, they’re also expensive vs history, and meanwhile bonds are outright cheap.
Source: Chart of the Week - Stocks vs Bonds Topdown Charts
7. Not Bonds — Microcaps: Turns out you need a microscope to look at microcap returns! This chart, almost looking like the bond market drawdowns chart, shows microcaps’ drawdown off the 2021 highs are approaching 2020 levels. Outside of big tech, things are Not OK.


