

Welcome to the latest Weekly S&P500 #ChartStorm!
Notes from this week’s charts:
Global equity technicals point to short-term rebound.
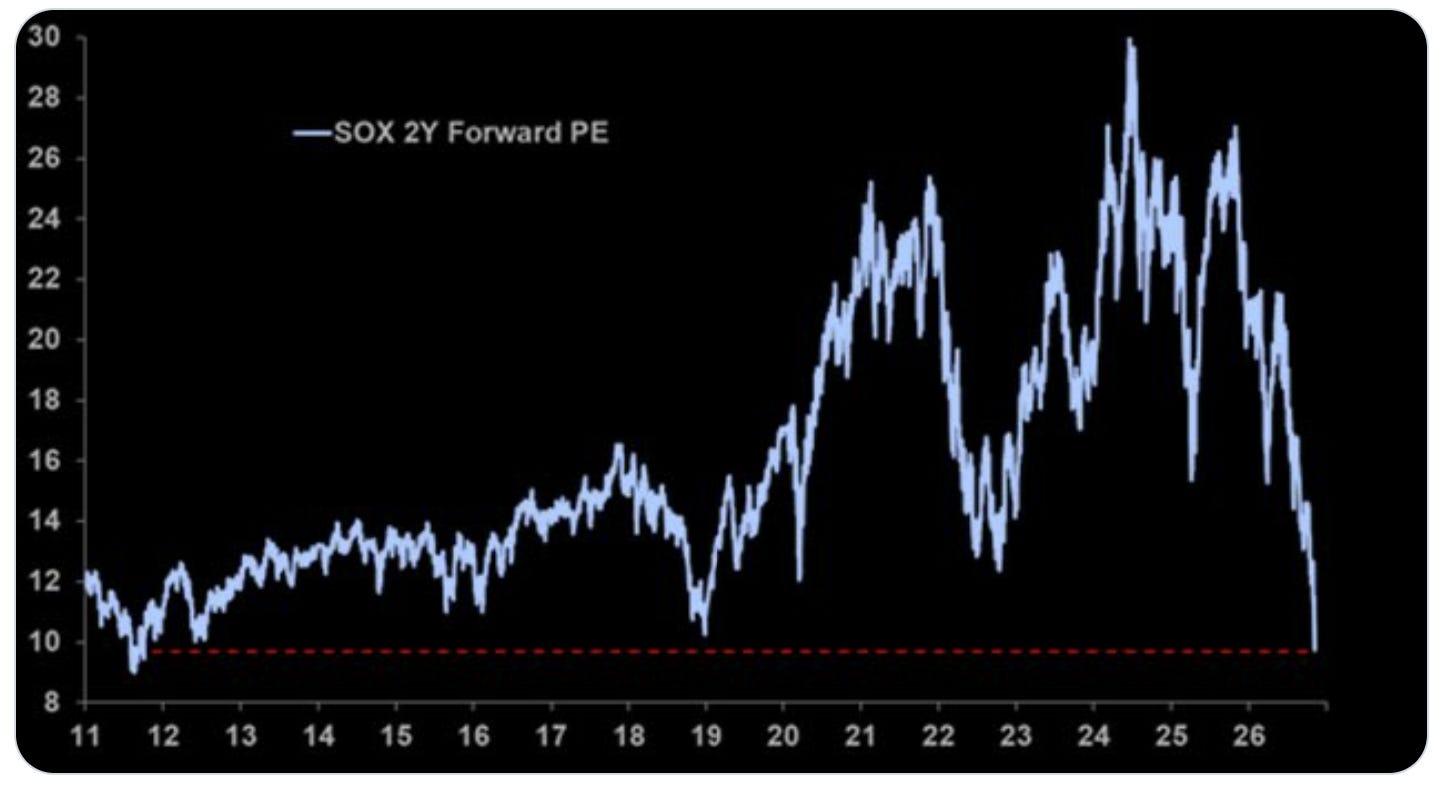
Semis look extreme cheap (…on a 2yr forward PE basis).
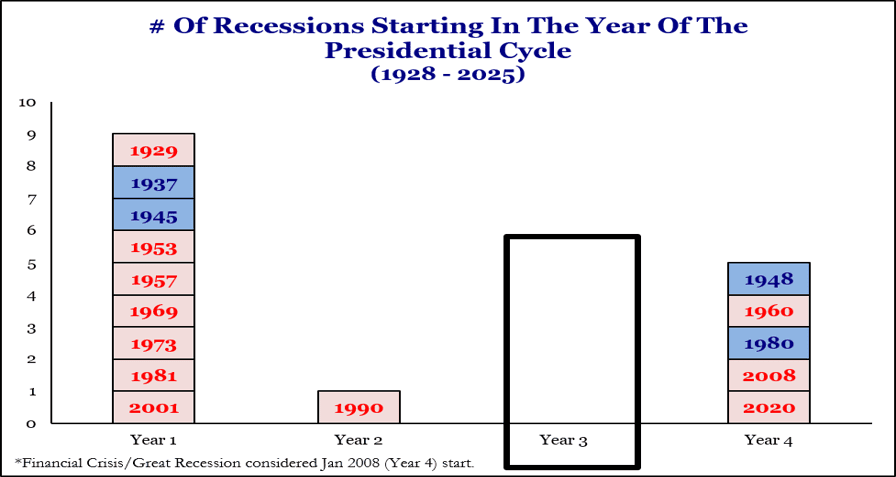
Recessions have never started in year-3 of the election cycle (hmm).
Foreigners have been piling into US equities.
Big picture trend is up, shorter-term stuck in the range.
See below for the full set of charts and details behind these points + the [new] market outlook section at the end for my latest assessment.
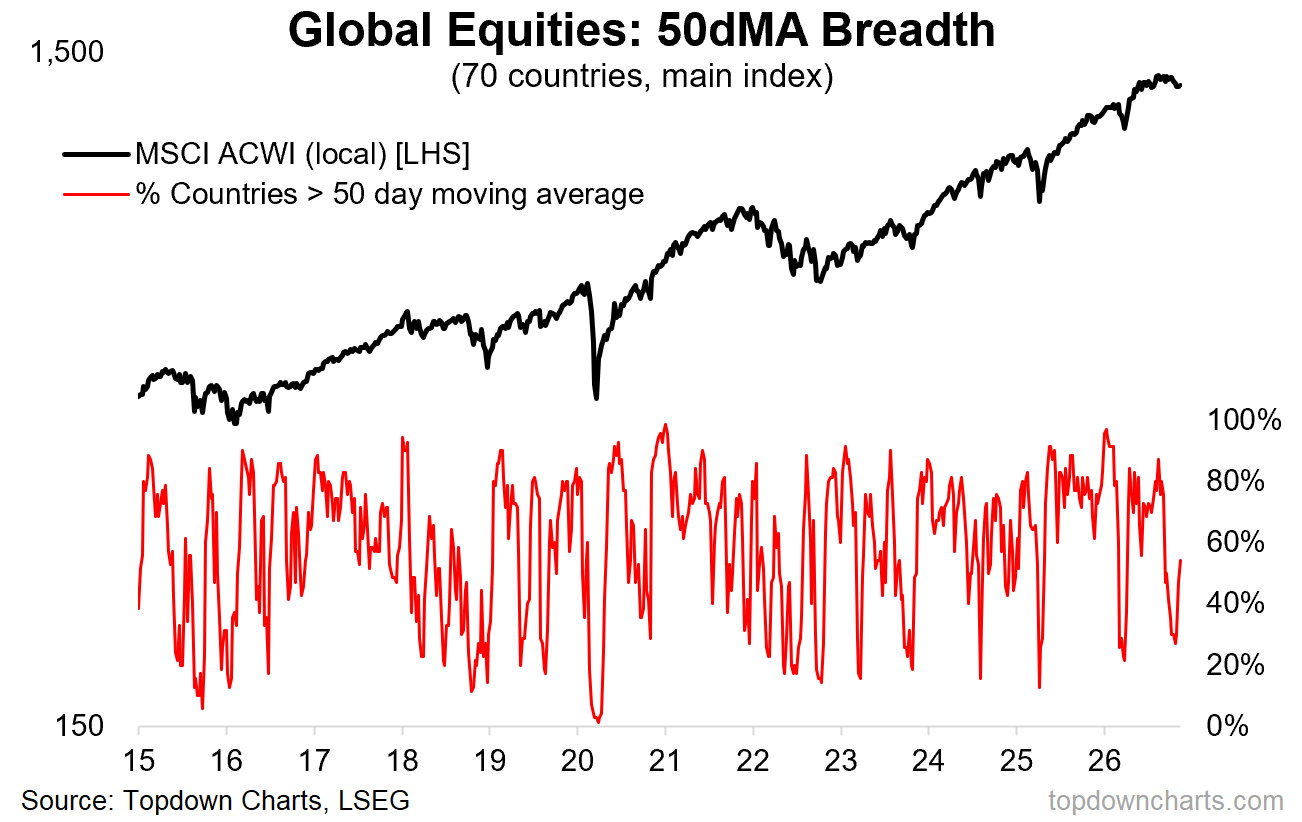
1. Global Equity Technicals: global equities appear to have found short-term support and 50-day moving average breadth across countries is ticking up from oversold levels (similar to what it did in late-24, early-25, and earlier this year.
This type of pattern is a buying signal when the market is in an uptrend — and it still can work as a short-term rally signal in trendless/down-trending markets.
Source: Topdown Charts Pro
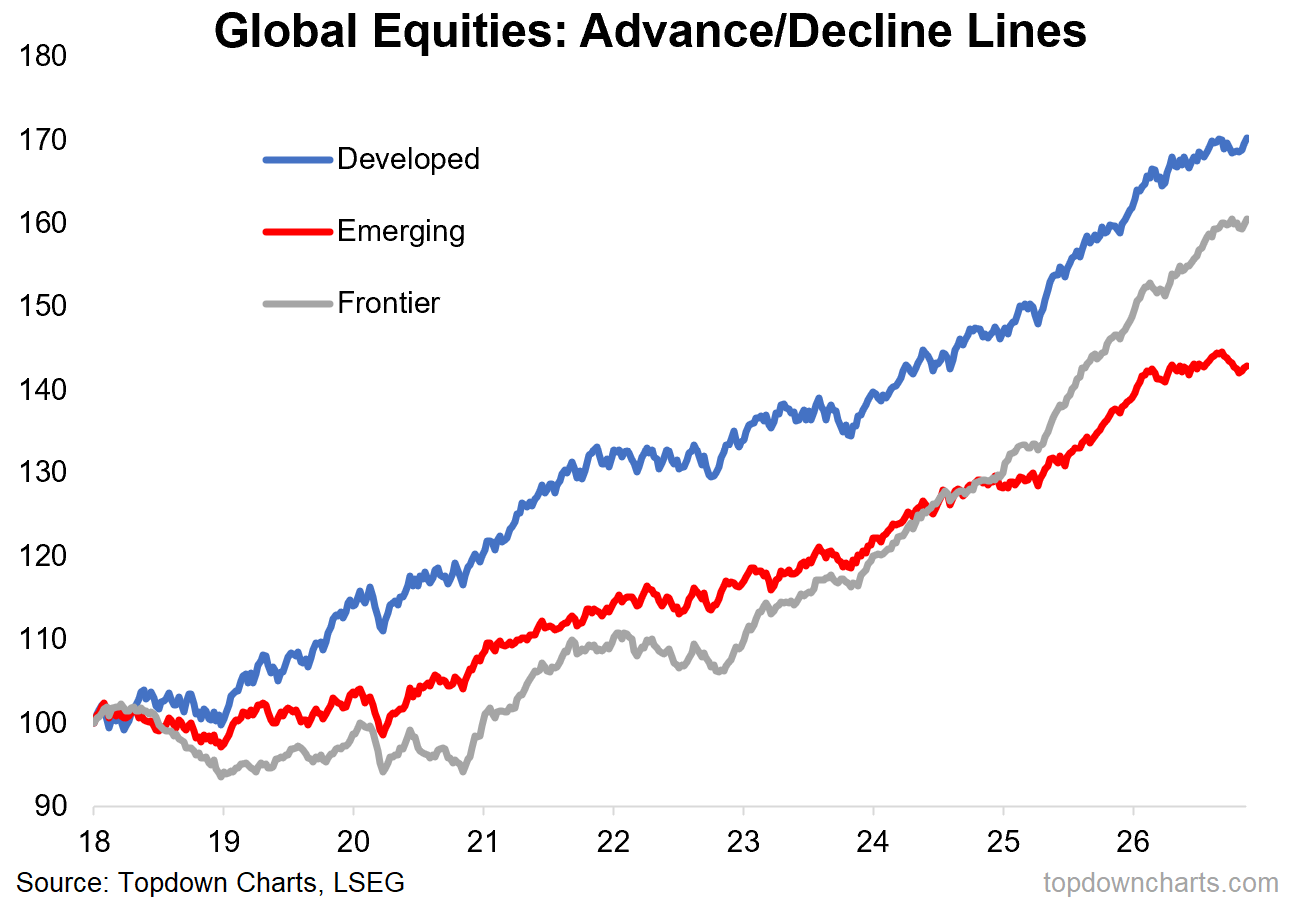
2. Country Group A/D-Lines: add to that —the advance/decline lines across country groups have started to tick up again after stalling and slipping in recent months.
From a technical standpoint the uptrend in global equities is intact and markets look to be rebounding from oversold levels. Not bearish.
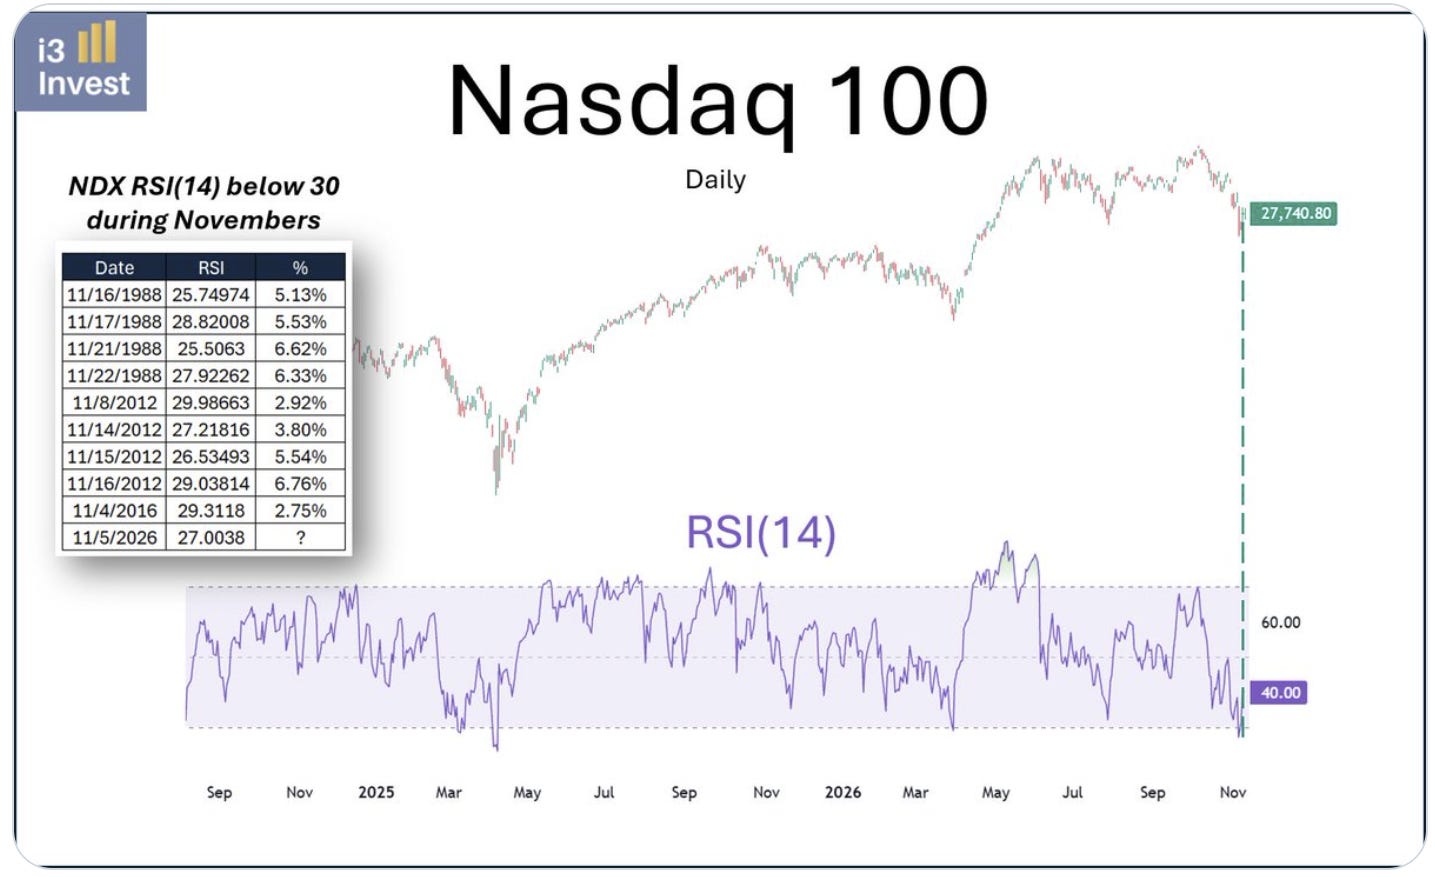
3. Nasdaq RSI Rebound: the Nasdaq 100 is also rebounding from oversold levels. Apparently every time the RSI went below 30 during November since inception, the Nasdaq rallied an average 5%. Trouble is it’s already up precisely 5% off the 5-Nov close. Rebounds are one thing, next steps are another thing.
Source: @i3_invest
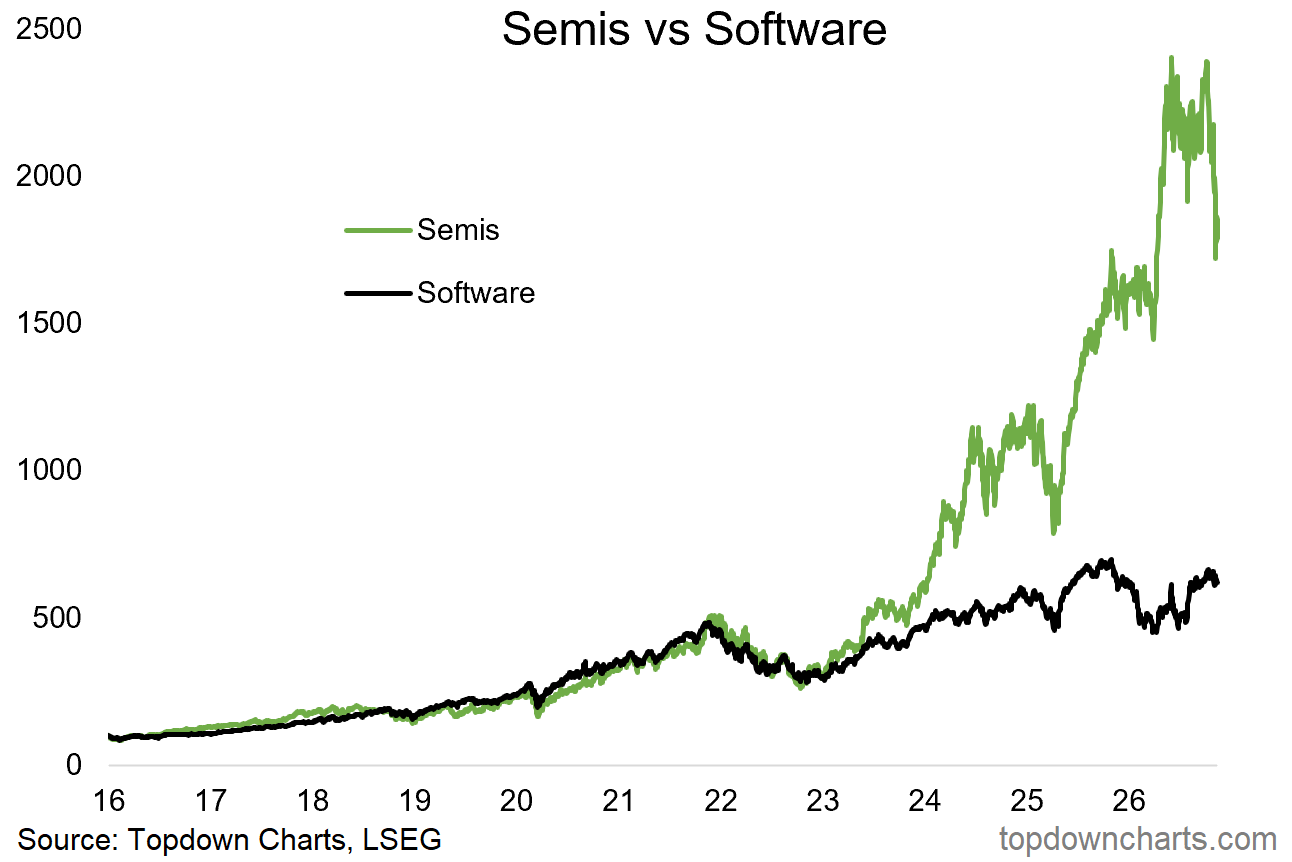
4. Semis & Software: they walked a similar path for a long time, but the AI age saw semis sharply pull away. Since peaking in June semis are off some 30%, and now sitting at a key support level.
(p.s. I would highlight that something which has already fallen 30% could still fall another 30% [technically it could fall 30% on an infinitely recurring basis (especially if the said stock did reverse splits to avoid delisting)] …which is certainly not a forecast, but a caution against blind-buying something just because it fell a big percent)
Source: Topdown Charts Professional
5. Semi Deep Value: speaking of semis, on a price to 2-year forward earnings basis, the SOX is now almost as cheap as it was back in 2011, cheaper than 2020 and 2022.
This is a hard one. We could say well those earnings are illusory, they’re literally made-up: it is based on analyst consensus expectations… which are based on thorough research and analysis, but still: made-up. And then the next thing is even if you hit those earnings, do you repeat that? Or does the AI boom turn to bust, as many of the capex projection charts point to (most I’ve seen say capex peaks in 2027) + if you get a downturn or short-term overbuilding, you could easily see a period of softer earnings.
And that’s essentially the message here —the market does not believe either or a combination of: the earnings estimate get realized, or said earnings are sustainable.
(but then again, you could say similar things back in 2022 before one of the biggest bull markets in recent years took-off… so maybe we don’t overthink it too much?)
Source: @caprioleio
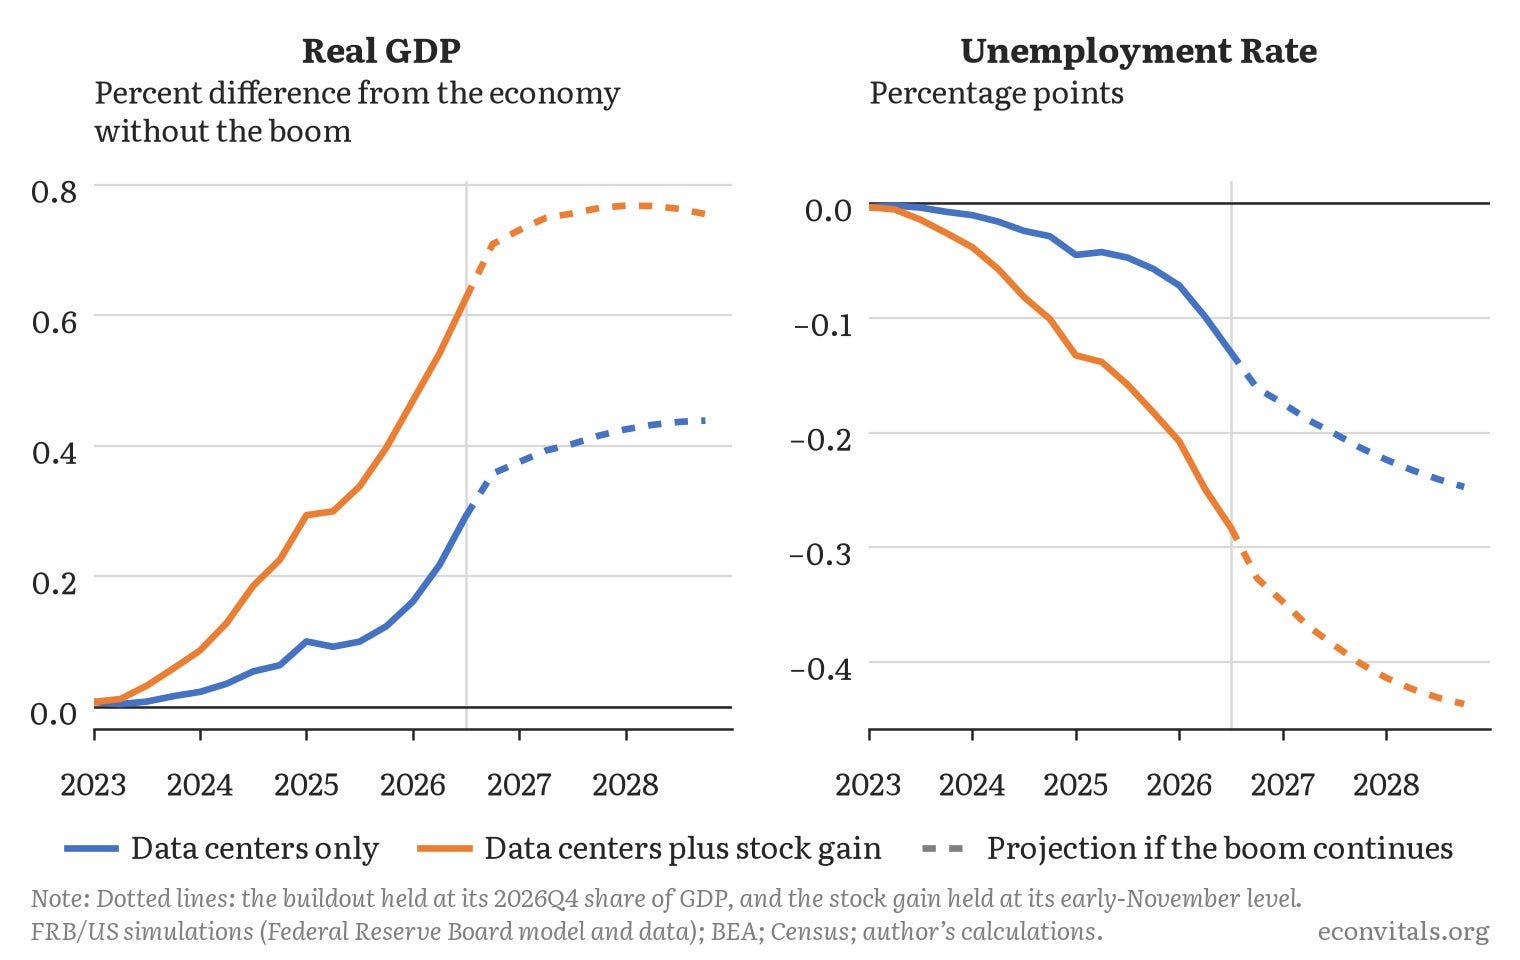
6. AI Boom Economic Impact: rising stock prices “because AI” has had a bigger impact on the economy than the actual building of datacenters has. A big part of this is how household allocations to equities have risen to record high levels, and even a bigger weighting than real estate — the wealth effect for stocks is a huge deal. It’s also why the economy will probably struggle to withstand the effects of a major downturn in stocks.
(which also becomes a bit circular if you think it through…)
Source: @jasonfurman
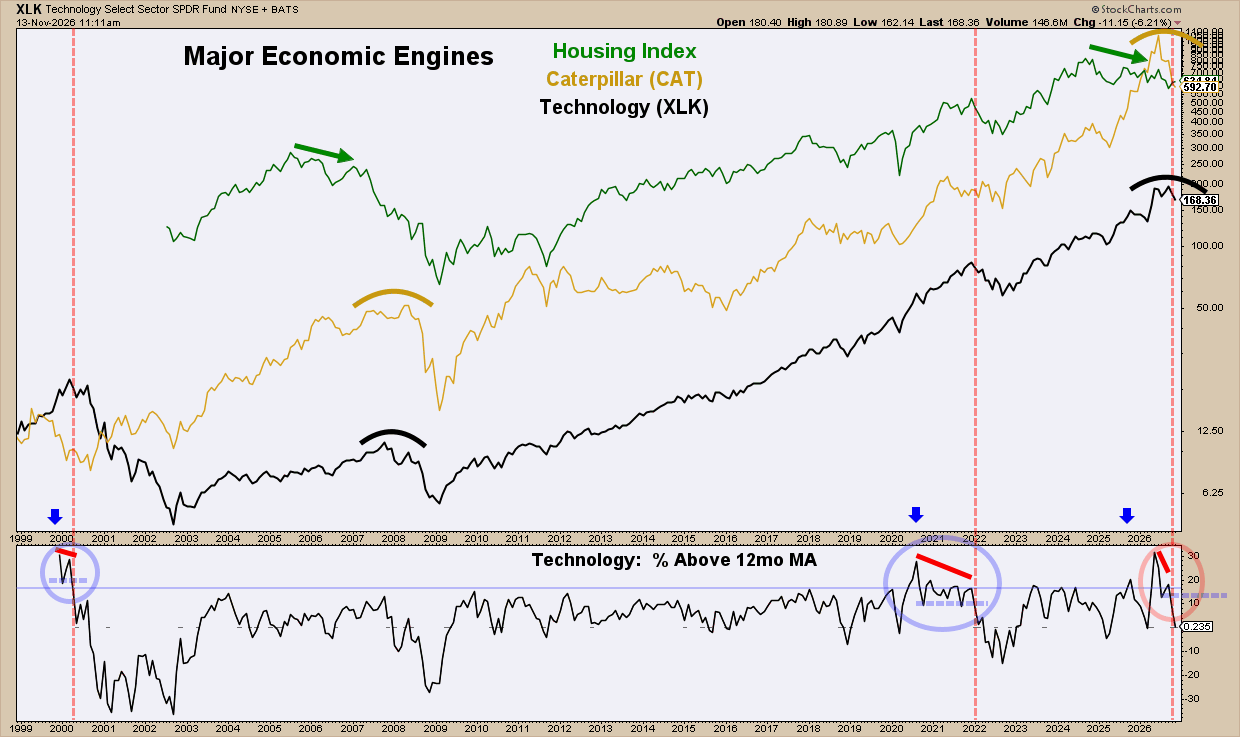
7. Macro Markets: on the macro front, Jim Knarr points out: “the Housing Index (US economic indicator), Caterpillar Stock (global economic indicator), and Technology (growth indicator) — all 3 are demonstrating major topping aspects similar to years 2000, 2008, and/or 2022.” Which is a useful set of indicators to monitor as leading indicators start to sour.
Source: @ChartMonitor
8. Recession Rarity: for this one you either look at it and say “it never happens” …or “it’s bound to happen”.
There’s no reason for a recession not to start in year-3 of the presidential cycle, and the chart below is a description of the past, not a statement of forward-looking probabilities. I think the probability is higher than zero (but my leading indicators say the worst of the slowdown comes later in the year; maybe it slips to 2028).
Source: @BairdStrategas via @RyanDetrick
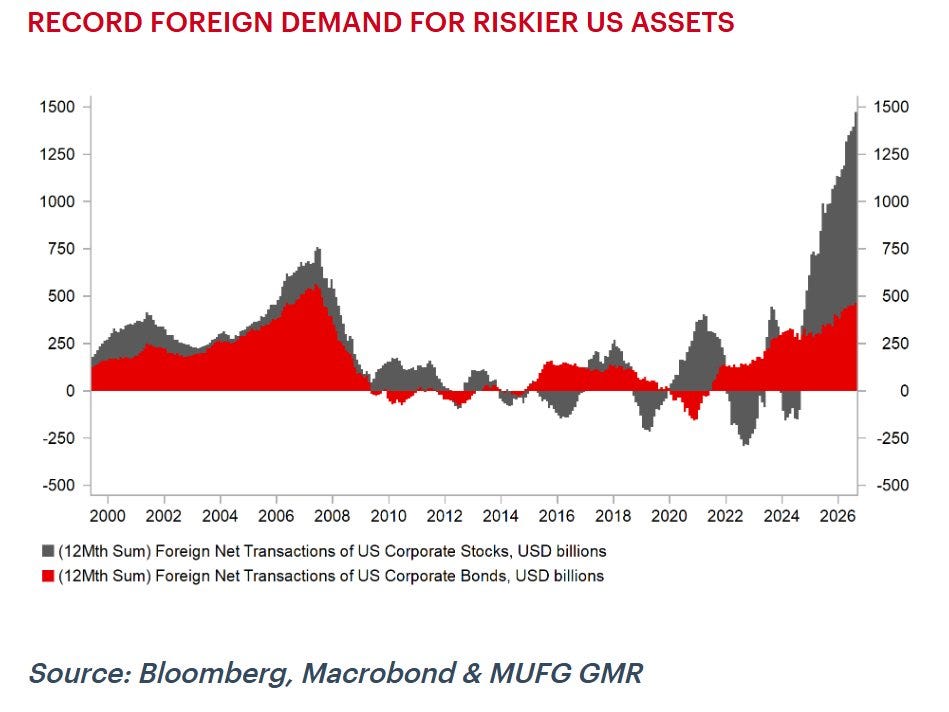
9. Foreign Flows to US Assets: foreigners have been scrambling into US assets.
Source: @TheStalwart
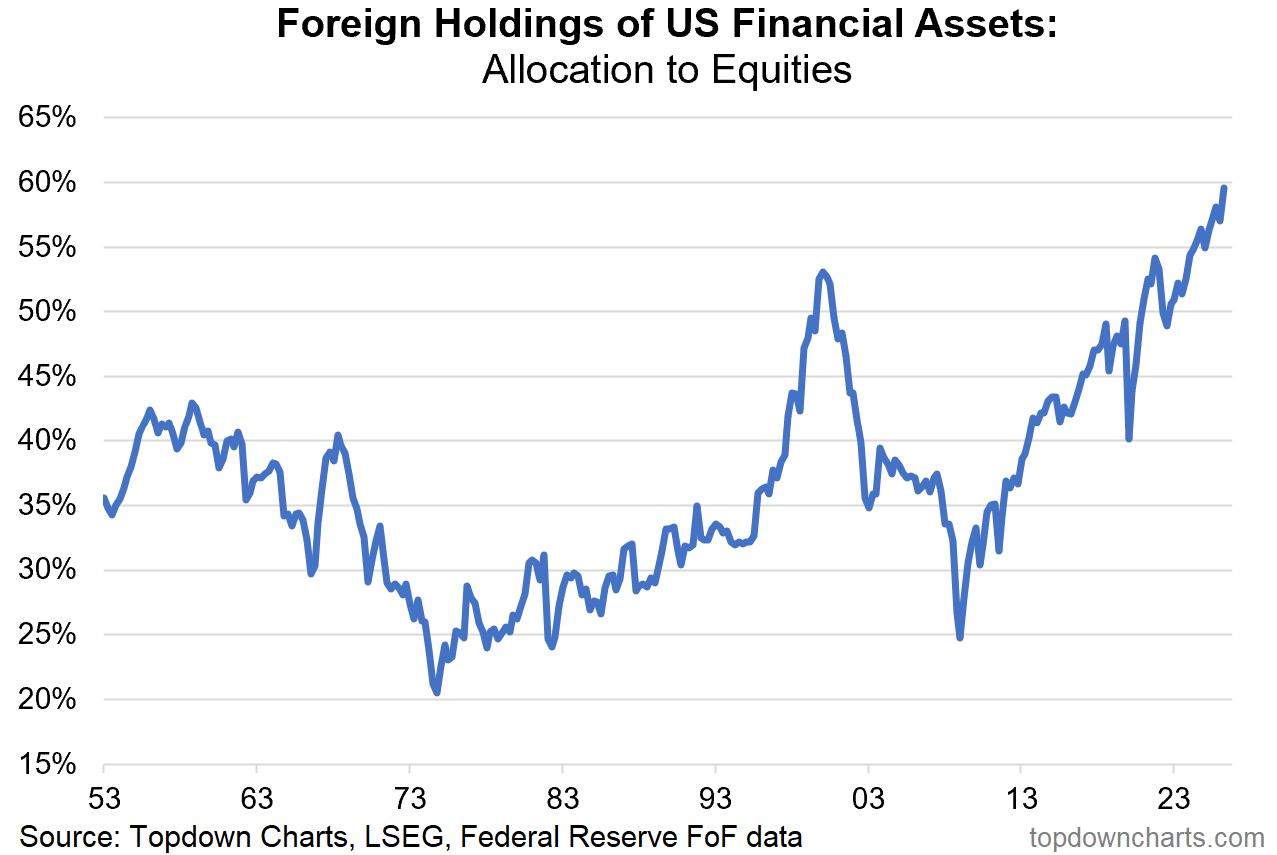
10. Foreign Allocations to US Equities: that (+market movements) has seen foreigner allocations to US assets skewing heavily into equities —add this to the “things that look like dot com” folder.
Source: Topdown Charts Professional
US Stockmarket Outlook: 5-factor framework
The background risk setup remains an issue with valuations expensive, positioning extended, sentiment bullish, and monetary policy turning to headwinds. For now macro/earnings are supportive and the uptrend remains intact; but I’m keeping a closer eye on technicals for cues on risk and timing.
Overall stance: on-watch (increasingly risky outlook).

The table above uses the “Topdown Charts 5-Factor Framework” for analyzing macro and markets to give an overall assessment on the US Stockmarket.
Factor in Focus — Technicals
Looking specifically at the equal-weighted S&P500 to get a sense for the Stockmarket as a whole (rather than the top 10 cap-heavy stocks in the cap-weighted index), the SPXEW technically remains in a solid uptrend: higher highs and higher lows, price above 200-day average, 200-day average upward sloping, 200dma breadth at solid levels.
But we also have several key short-term lines in the sand.
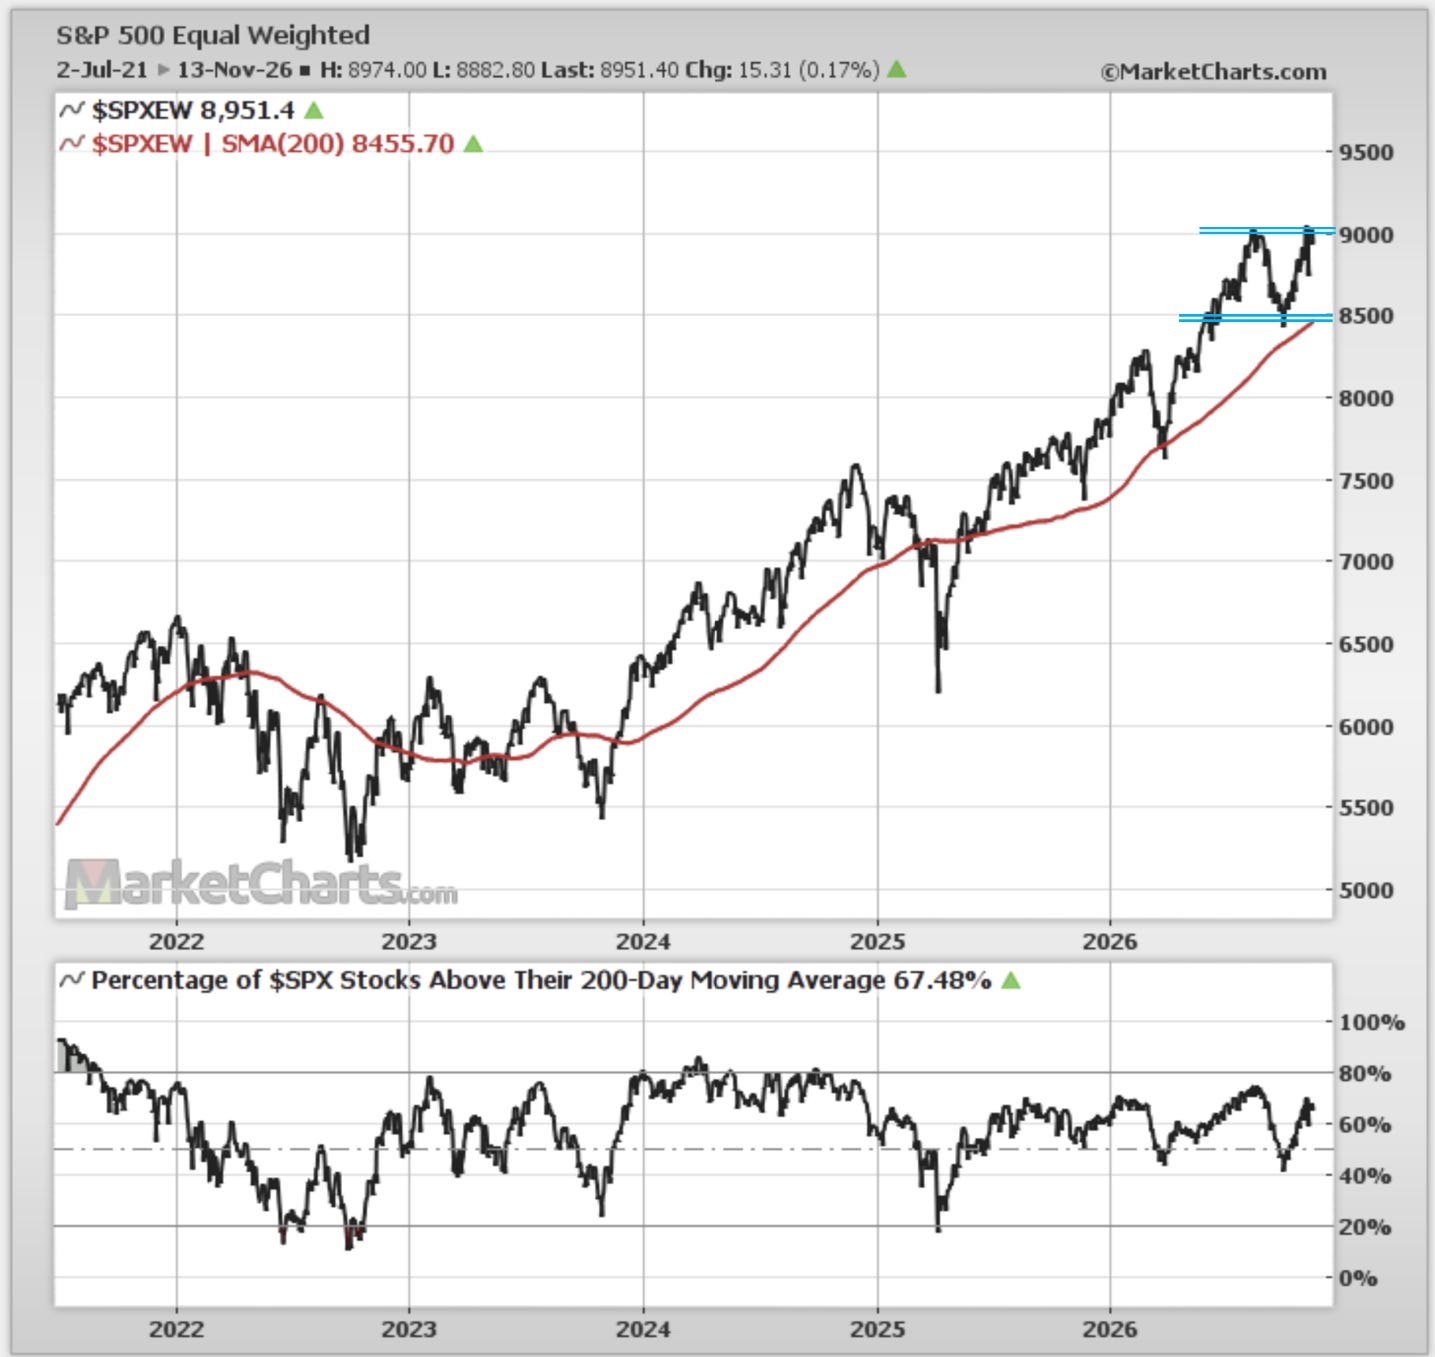
On the upper side, there is heavy resistance around 9000 (breaking through this will be unambiguously bullish). On the lower side, support has so far stood firm at 8500 — on the short-term front if the index rolls over from resistance the next step would be support; breaking that would be a very bad sign for the cycle.
Add to that breadth is also tracing a fairly well defined range since 2025, and it tends to stall around these levels.
Given the uptrend we give it the benefit of the doubt to the bullish side. But given the adverse risk backdrop we stay attuned to short-term downsides. It sounds like a cop-out with your classic talking head saying “if it goes up it will go up” —but this is just the reality of where things are sitting at the moment. It’s simply not clear-cut, but at least the ranges and frames are clear.
—
Best wishes,
Callum Thomas
Founder & Editor of The Weekly ChartStorm
and Head of Research at Topdown Charts
Connect: LinkedIn | Twitter/X | Substack
In case you missed it, also see last week’s edition:

Obtain Deeper Insights with Topdown Charts

.