
Weekly S&P500 ChartStorm - 15 June 2025
This week: technically ready, geopolitics, sentiment and positioning, asset allocations, stocks vs bonds, market cycles, energy stocks...

Welcome to the latest Weekly S&P500 #ChartStorm!
Learnings and conclusions from this week’s charts:
Stocks are stumbling on geopolitics (S&P back below 6000).
Most of the time geopolitics can be ignored, with some exceptions.
Sentiment remains mixed, skittish, still skewed bearish/defensive.
Yet investor allocations to stocks are historically elevated.
Energy stocks are unloved, undervalued, and unprepared for oil price upside.
Overall, a key theme to think about this week is timing. As I point out, when you study market technicals, you find events/excuses have a habit of showing up at times when the market was ready to move but just waiting for an excuse. Likewise, when it comes to geopolitics, the nature of the event matters —but more importantly; the stage of the market cycle and wider pressure points matter most. Fortunately you have people like me Monitoring The Situation on both of these fronts, let’s take a look…
n.b. check out the recently added “Getting Started” section (how to make the most of your subscription to the Weekly ChartStorm).
1. Roundnumberitis? Funny thing about markets and macro is that events/excuses tend to show up around technically convenient points. I mentioned this the other day with regards to WTI crude oil rebounding off a major long-term support level and big washout in sentiment — but we also have an example here with the S&P500 stumbling just after retaking that big 6000 round number.
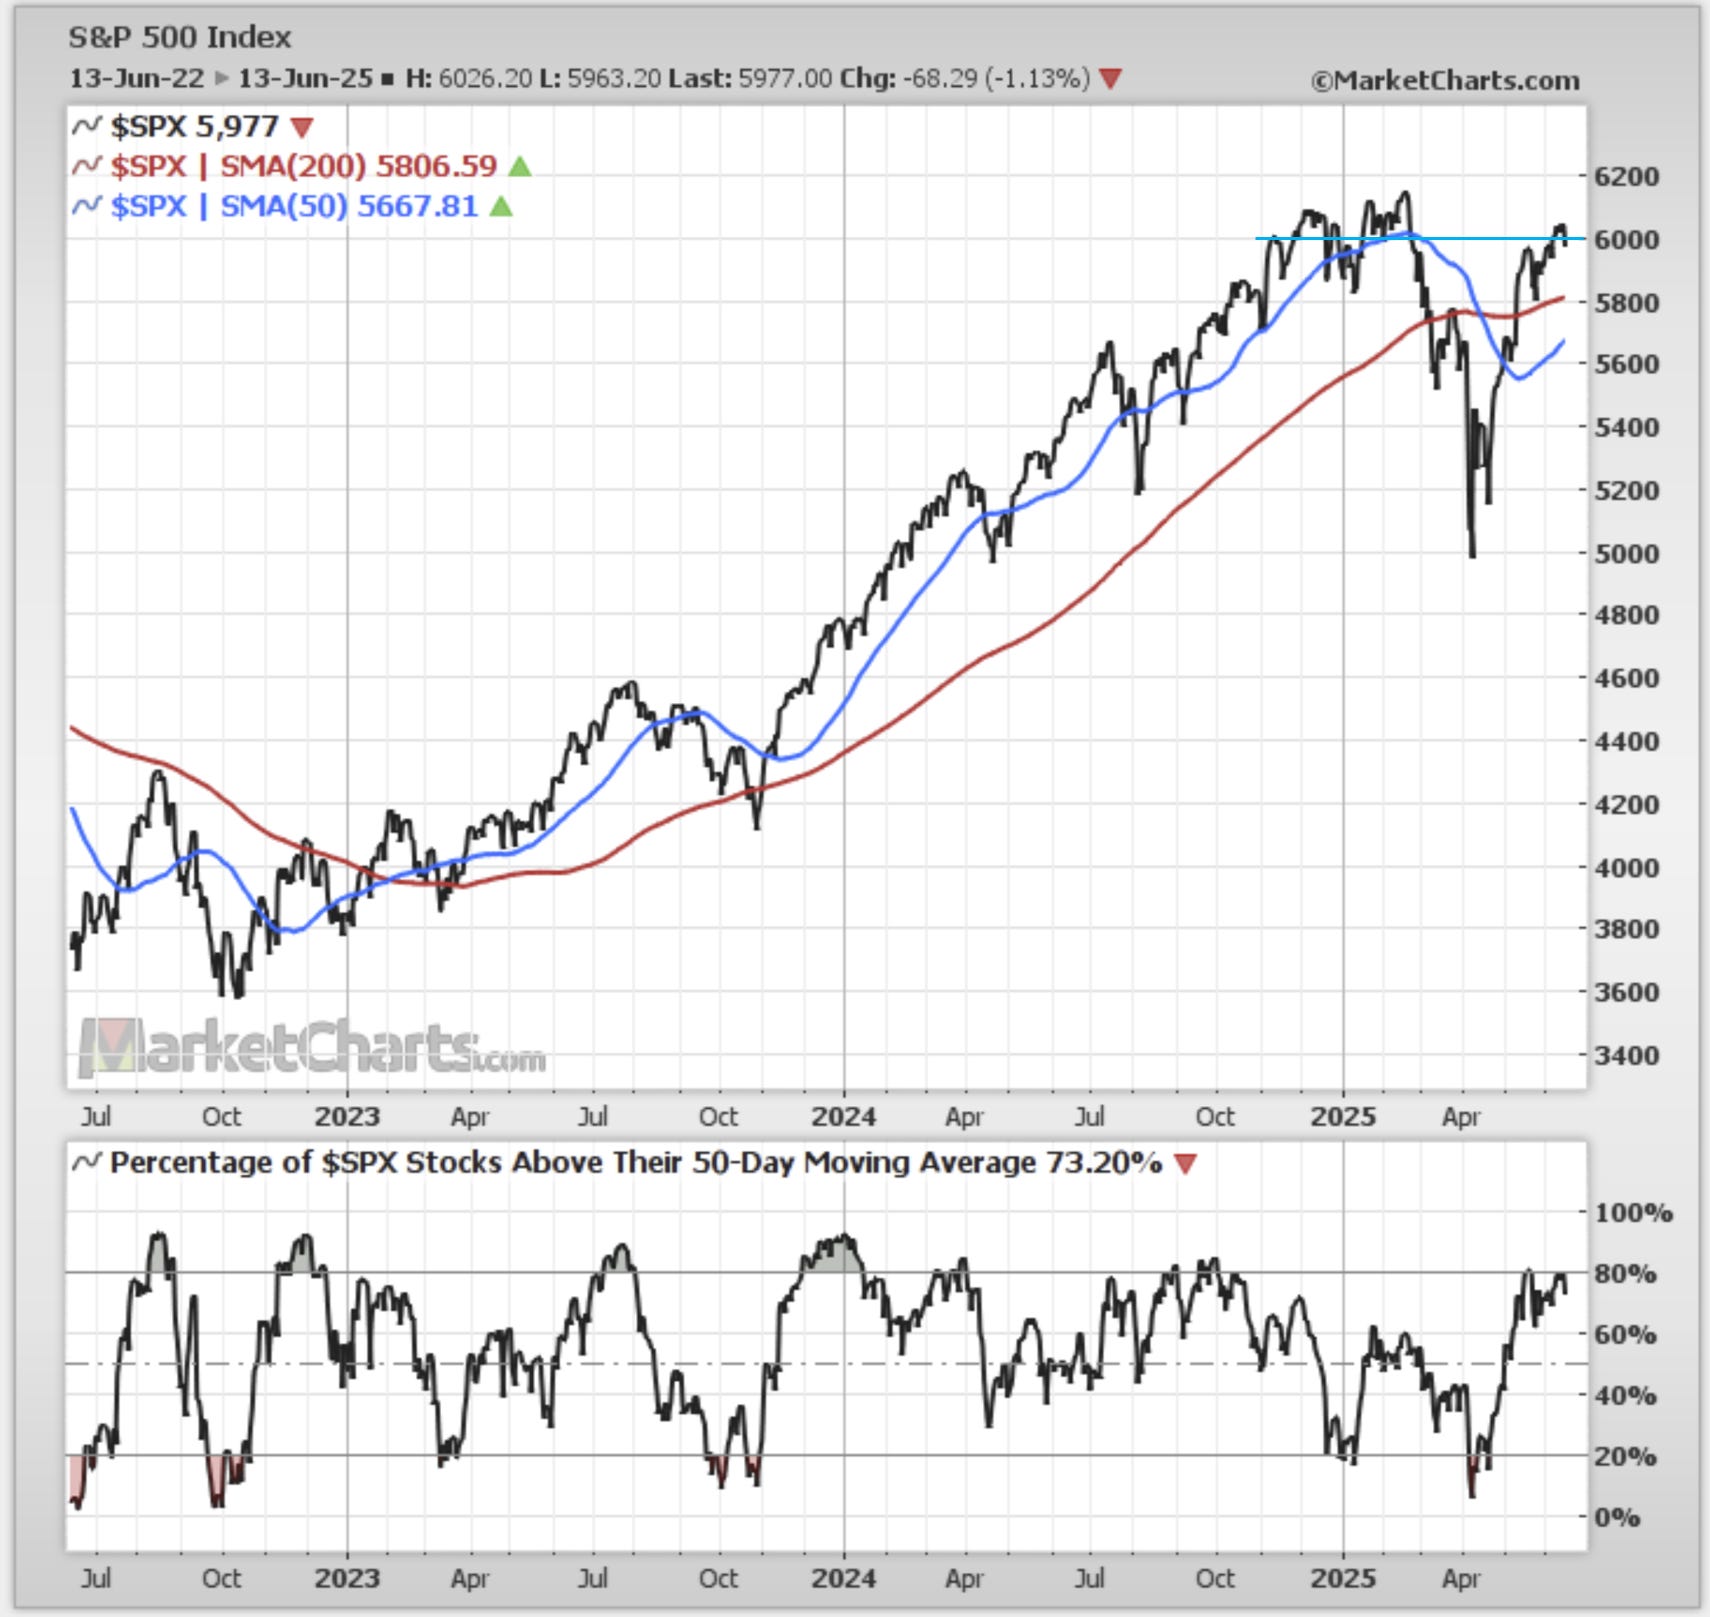
Source: MarketCharts
2. Geopolitics: In case you missed it, the excuse/event was Israel taking action on Iran. Now, I’m not going to pretend to know what’s going to happen next there, but I include the table below for a couple of reasons.
First is to keep things in context, a lot of geopolitical events, even major ones, have barely budged markets in the past aside from an initial knee-jerk, and in many instances the initial panic selling was a buying opportunity.
But there are examples where the events were more significant, or came at a time where the market was vulnerable, or triggered off macro pain points. A prime example of that was the 2022 Russian invasion of Ukraine; the stockmarket was extreme expensive and sentiment was all-in late-2021… so it could have taken any excuse to trigger downside; but you also had the flow-on effects from the invasion which were a spike in commodity prices and inflation (macro pain points).
The risk case here is that we’ve already rebounded back to expensive levels for stocks, and sentiment is a bit skittish at the moment, and there is a tail risk of oil price shocks — so while we want to keep things in perspective, it would be wrong to dismiss downside risks entirely.
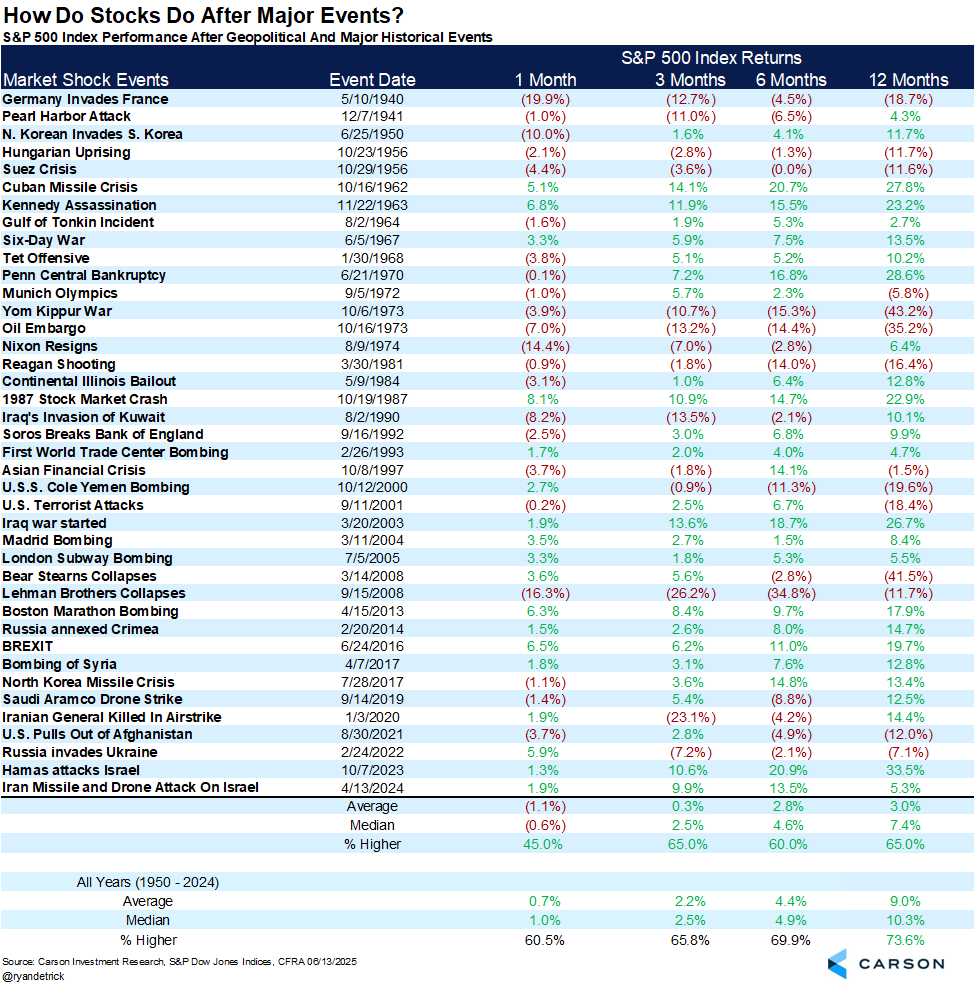
Source: @RyanDetrick
3. Investment Managers: Speaking of sentiment let’s take a look at a few key datapoints. First is investment manager sentiment — risk appetite has begun to recover, but overall investment managers remain fairly pessimistic/defensive as concerns remain elevated around: valuations, (geo)politics, and policy (e.g. fiscal largesse vs monetary policy constraints, and generalized uncertainty).
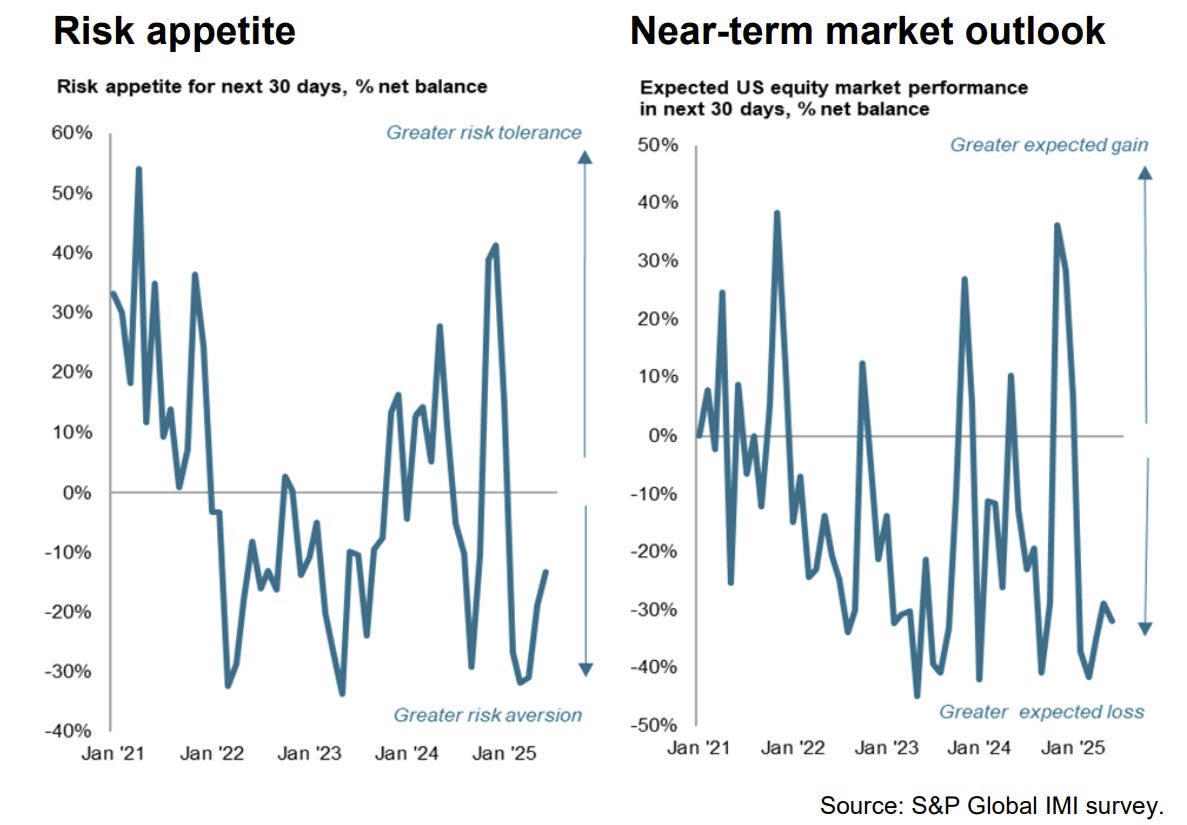
Source: Investment Manager Survey
4. Retail Investors: According to the Schwab Trading Activity Index, retail sentiment likewise remains subdued, with Schwab clients apparently taking profits on previous dip-buying, and using the rebound in stocks as a selling opportunity.
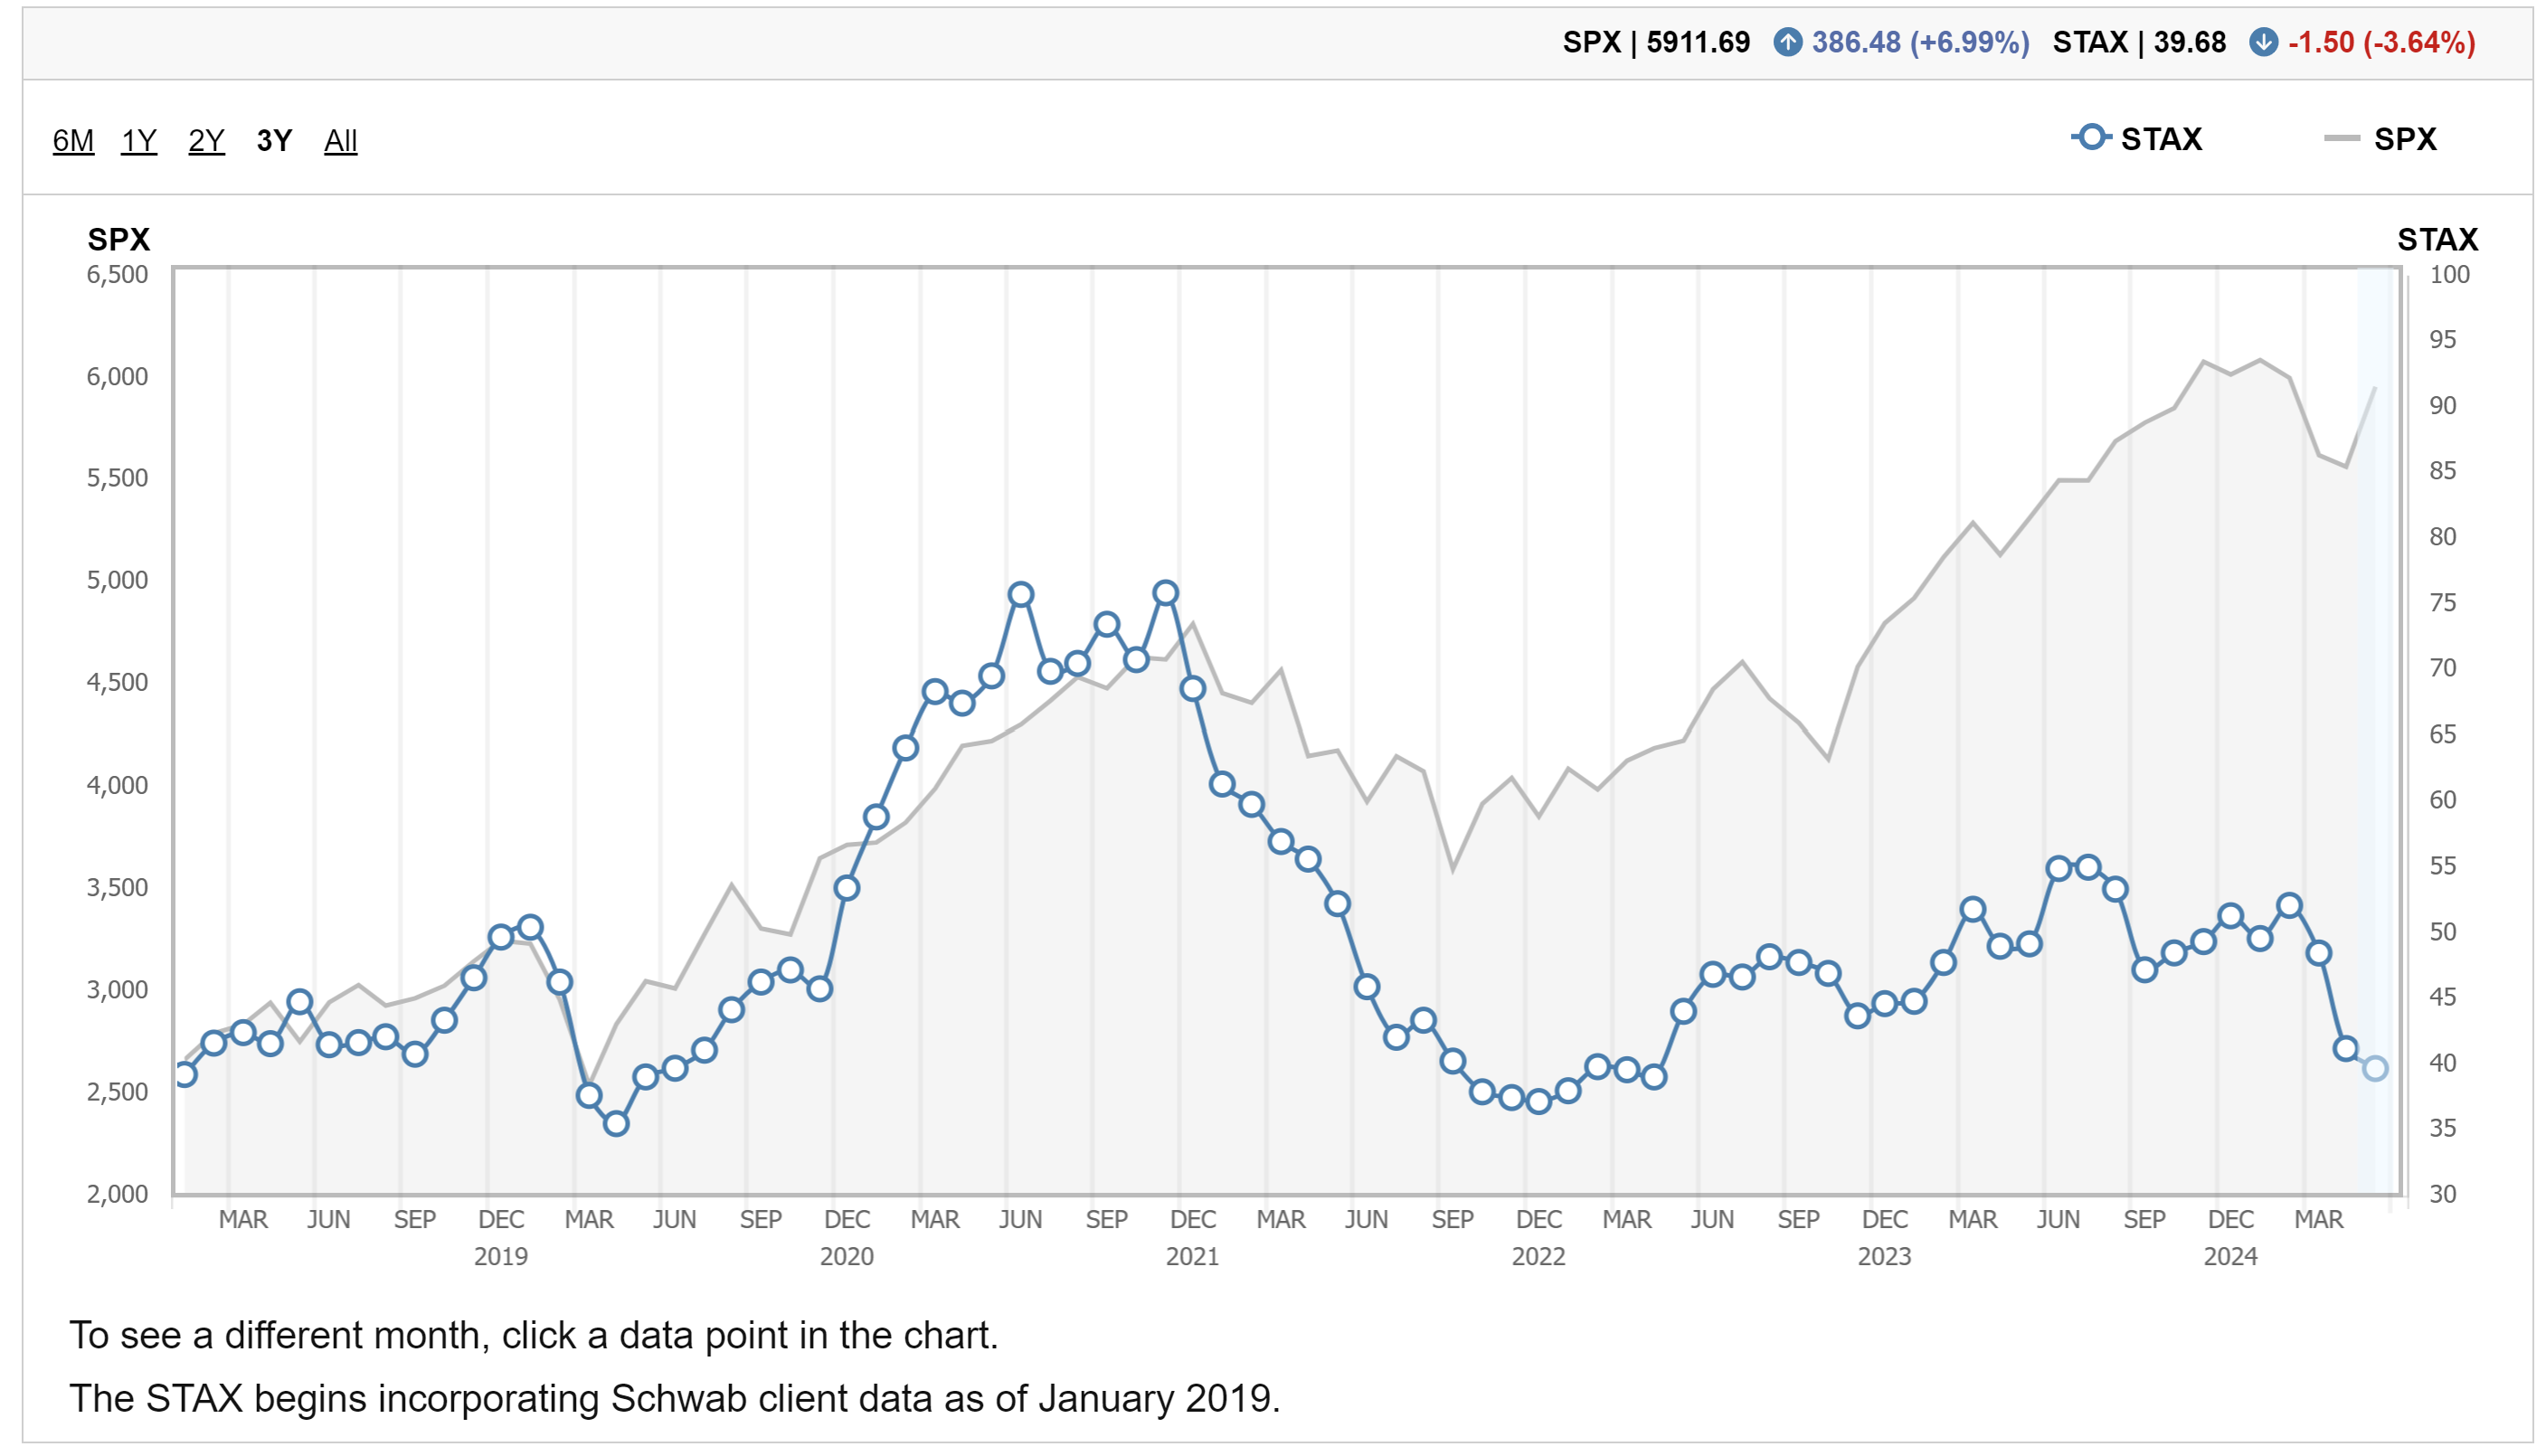
Source: Schwab Trading Activity Index
5. Investor Euphoria Cycles: As for my slower-moving Euphoriameter (which combines forward PE ratios with smoothed inverted VIX, and smoothed bullish surveyed sentiment), it’s still quite high. Partly due to the only brief and fleeting nature of the correction, this indicator only saw a partial reset from record high levels. This indicator remains in warning territory from a cycles analysis standpoint; you get concerned when things like this reach high levels and then roll-over. Albeit some might argue the correction earlier this year was simply a late-cycle reset.
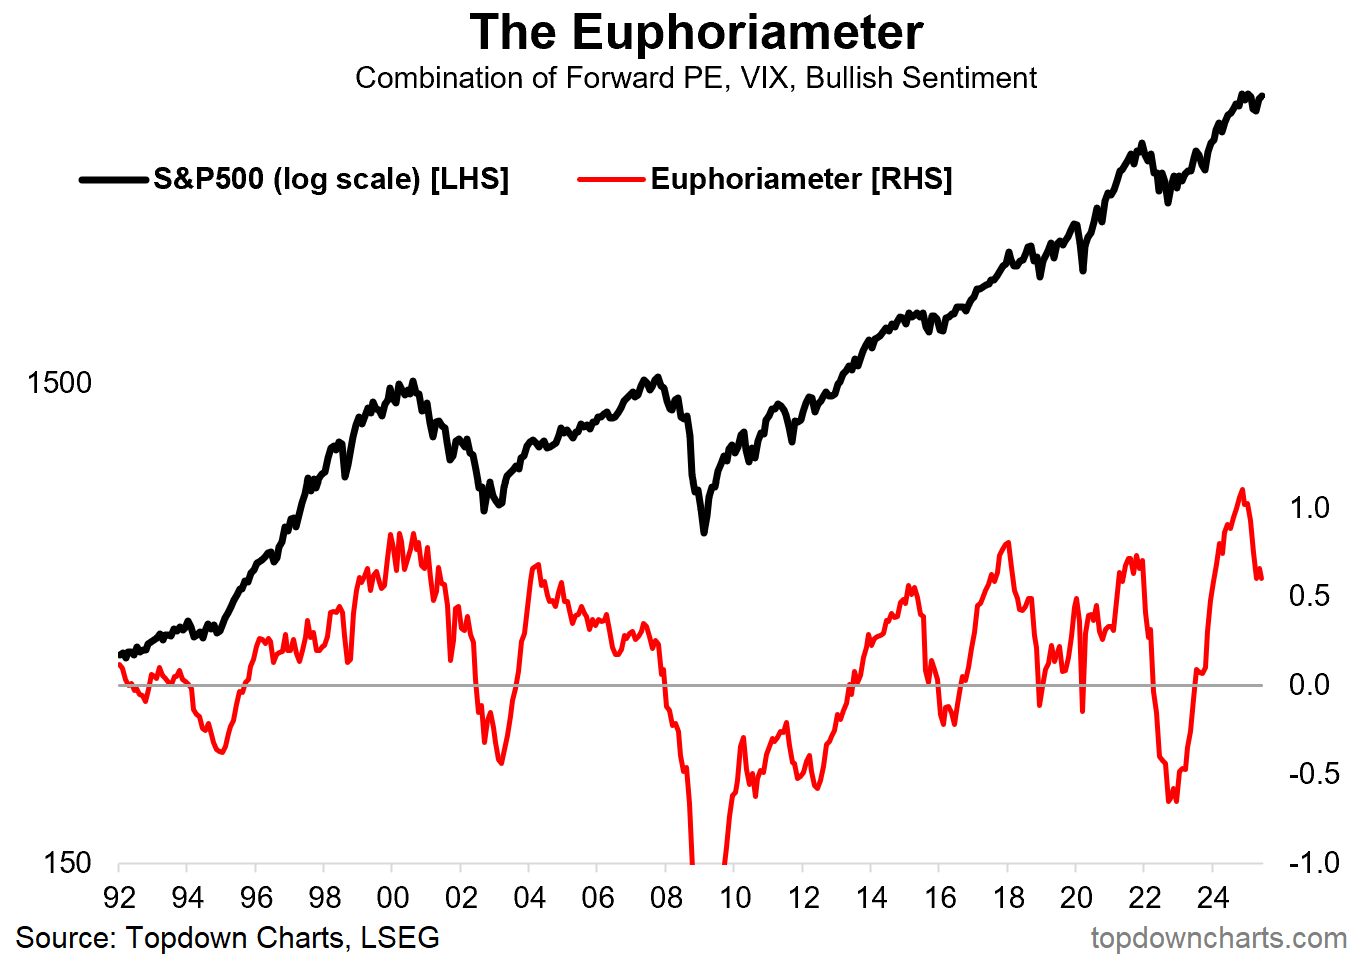
Source: Topdown Charts
6. Foreign Investors: Another key sentiment/positioning datapoint has been the initial reversal of a decade of major foreign inflows into US equities. This remains an elephant in the room because it has the potential for an unwinding of previous tailwinds (where foreigner rotation back out of US equities could become self-reinforcing). Even if we discount that though, it’s hard to see this tailwind persisting in a way that it did over the previous decade.
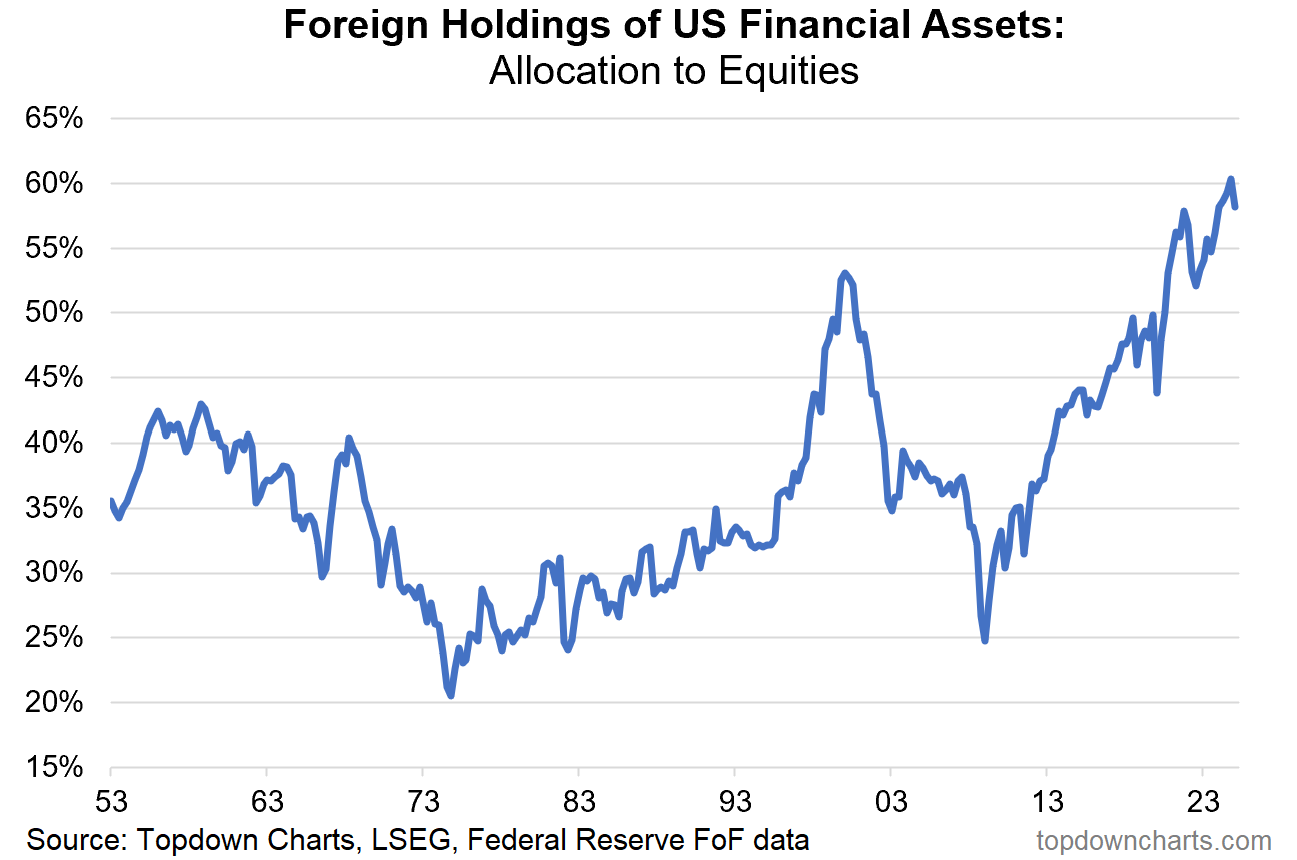
Source: Topdown Charts Professional
7. Sentiment vs Allocations: Also of interest is the sentiment vs positioning aspect. Surveyed sentiment crashed in April to one of the worst readings on record. But AAII and ICI information on investor portfolio allocations to equities showed only a minor adjustment, and likely a big portion of that was simply market movements. In other words, despite all the pessimism, investors didn’t really vote with their feet.
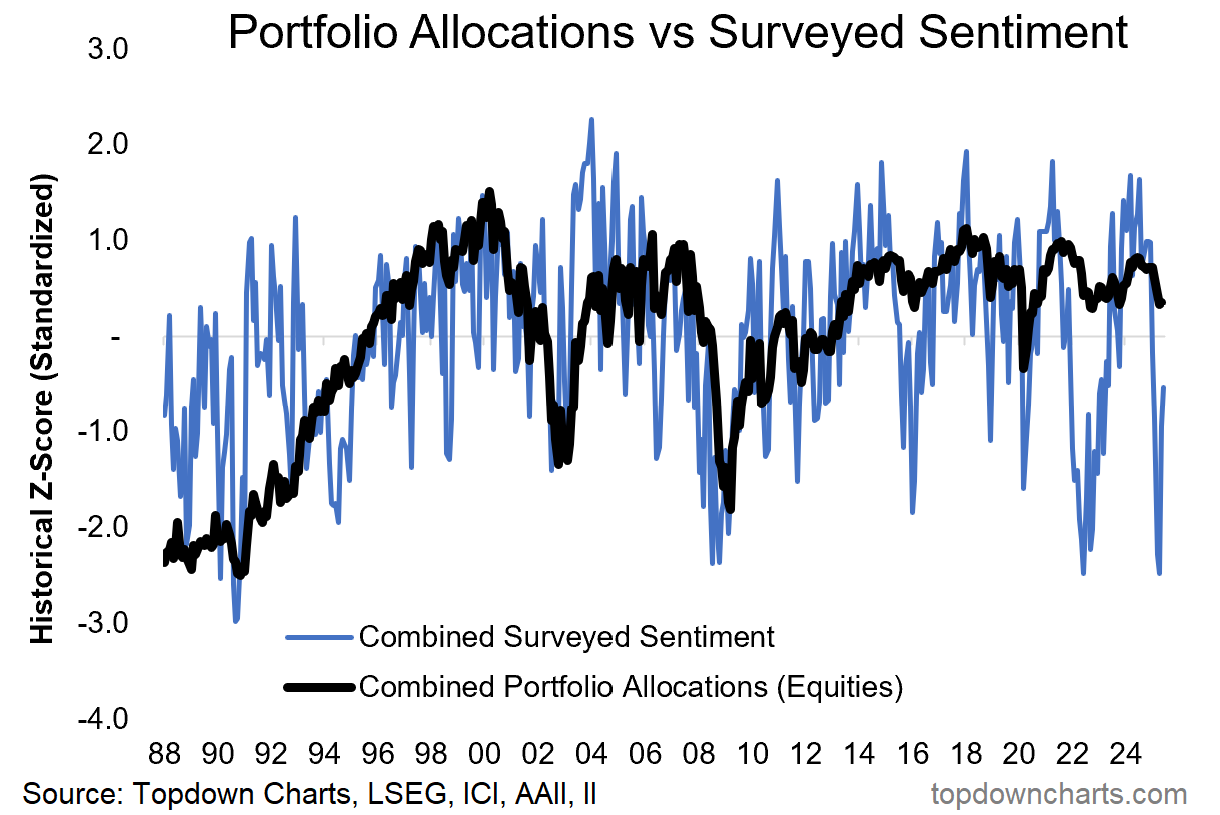
Source: Topdown Charts
8. Asset Allocations: And here’s another angle on that, aggregate allocations within the USA to equities reached an all-time high. Meanwhile allocations debt investments are at 40-year lows…
