Weekly S&P500 ChartStorm - 14 May 2023
This week: bored markets, investment manager warnings, retail buying, recession trading, commodity stocks, micro caps, small caps, foreign stocks, valuations, odd days, and loan officer ignorance...
Welcome to the latest Weekly S&P500 #ChartStorm!
Learnings and conclusions from this week’s charts:
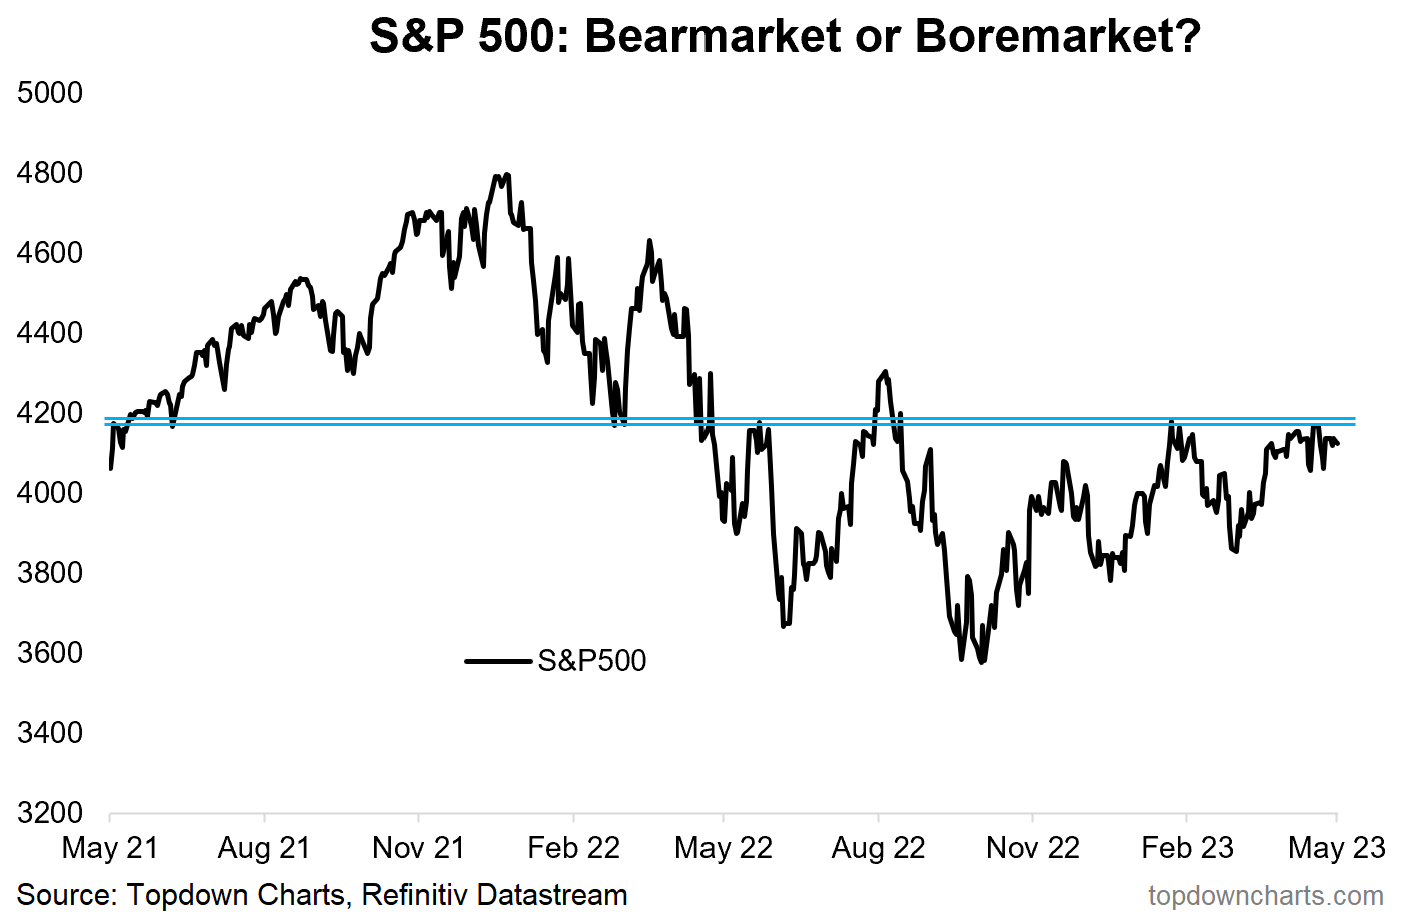
There are bull markets, bear markets, and bored markets.
Investment manager sentiment has plunged (and recent track record has been prescient, not contrarian), meanwhile retail buying is turning up.
Outside of perma-strong big tech, there are a number of pockets of weakness (banks, commodity sectors, micro caps) — all is not well under the hood.
Historically, even-dated days have outperformed odd-dated days.
Capital markets appear to be ignoring the warnings being sounded by bank loan officers (albeit this may actually be consistent with how markets have historically traded around recessions).
Overall, the range trade continues. But as noted, part of this is simply the battle between strong big tech and weak cyclical risk-on sectors. I think resolution will come either when/if the market finally breaks higher and bears capitulate, or when the fundamental/macro weakness starts to speak louder than big tech strength. Oh and by the way, those two scenarios are not mutually exclusive(!).
1. Bored Market: For all the debate about bear markets, it turns out we got bored markets instead! The S&P500 has been sandwiched between short-term support and major overhead resistance. The thing that first comes to mind on a chart like this is the market maxim “the best predictor of future higher volatility is current low volatility“. Or perhaps the cliché calm before the storm.
Source: @topdowncharts Topdown Charts
2. Investment Manager Sentiment: And speaking of storm clouds, the latest S&P Global survey of US investment managers shows the greatest risk aversion and downside expectations since the survey began. This is generally a more astute audience which has access to better information and resources than the typical retail investor, so it is interesting — but more interesting is how this does *not* appear to be contrarian.
Notice how it collapsed at the start of 2022 (a very bad year)… but also notice how it sharply improved into the October lows. As a point of interest, the factors within the survey that deteriorated the most were “fiscal policy“, “political environment“, and “valuations“ — or in other words, they basically think the market is too complacent to debt ceiling default/debacle risk.
Source: US Investment Manager Index
3. Retail Investor Sentiment: Meanwhile retail is steadily accumulating (the details of the TD Ameritrade “Investor Movement Index“ press release noted a lot of this was concentrated in tech/tech-related (TSLA) + some dip-buying in REITs. One interesting thing that stands out on this one to me is how the indicator is curling up after reaching washout lows.
Source: Investor Movement Index
4. Recession Trading: This chart basically provides a case study in how markets can trade around recessions. The key cautionary being that you can get substantial rallies both before and after onset of recession… only for those gains to be summarily erased (also note the confusing and frustrating range trades that happened during those times as well!).
Keep reading with a 7-day free trial
Subscribe to The Weekly ChartStorm to keep reading this post and get 7 days of free access to the full post archives.


