Weekly S&P500 ChartStorm - 14 January 2024
This week: sentiment, positioning, flows, IPO market, bullish broadening, US vs the world, China vs US, stocks vs bonds for the long-term, tech stock euphoria...
Welcome to the latest Weekly S&P500 #ChartStorm!
Learnings and conclusions from this week’s charts:
Consensus sentiment is highly bullish, and asset managers are heavily net-long stock index futures.
Yet, investment managers are worried about the near-term outlook given expensive stock market valuations and geopolitical tail risks.
Retail fund flows in aggregate are still in the doubt phase of the doubt vs hype cycle, but that looks to be in the process of changing.
There are early signs of potential “bullish broadening”.
Tech ETF market share has reached a new all-time high.
Overall, the sentiment picture is interesting. There is definitely an air of bullishness following the run off the October (2023) low, and the surveys and flows/positioning are clearly bullish, but there is some wariness, and rightfully so. High valuations, bullish sentiment, risk-on positioning… priced for perfection means you better get perfection, and there is still a real risk of recession, and equally a real risk of resurgence (inflation, rate hikes), and (geo)political boogeymen lurking in every shadow. We live in interesting times…
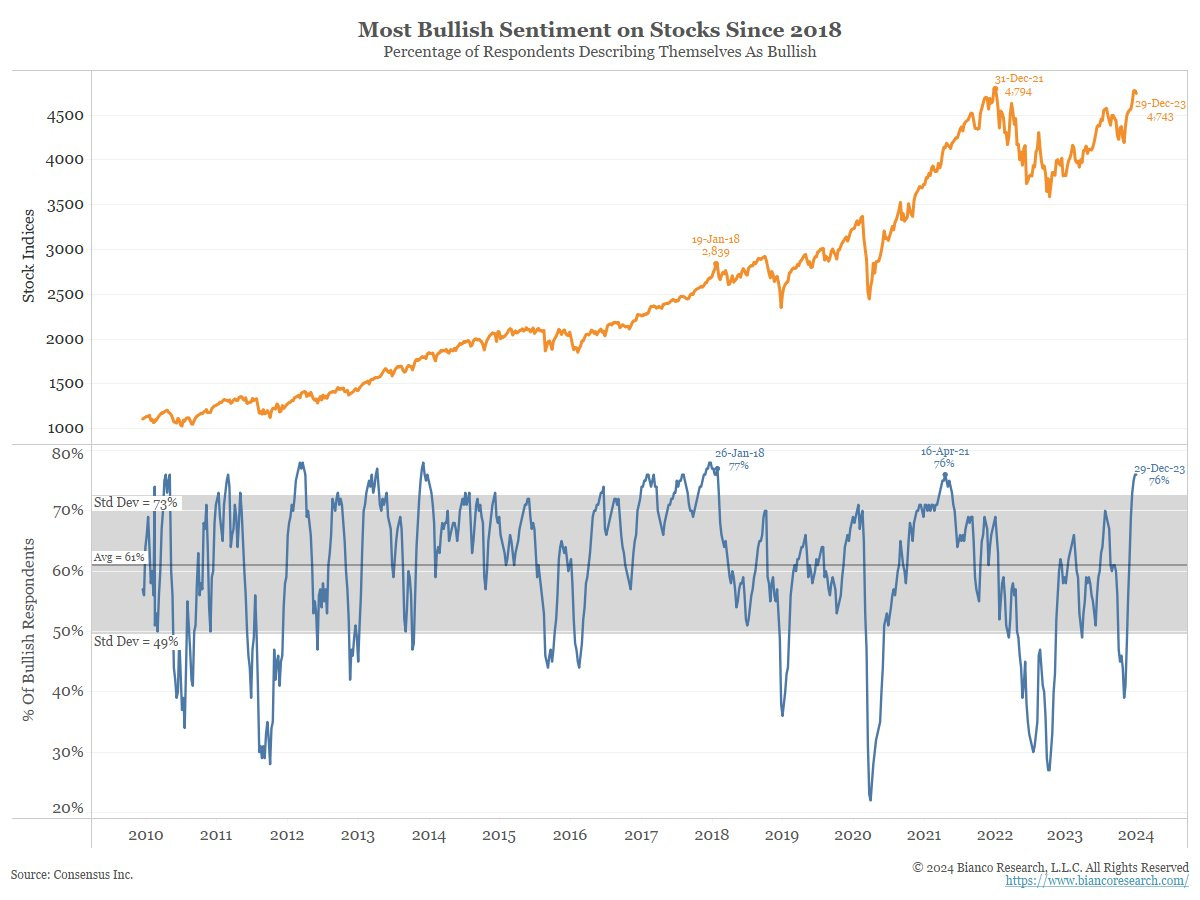
1. Bullish Consensus: The aptly named Consensus Inc conducts weekly surveys of futures market newsletters/brokerage reports and aggregates the percentage that is bullish. At this point their stock index series is the most bullish since 2018.
Source: @biancoresearch
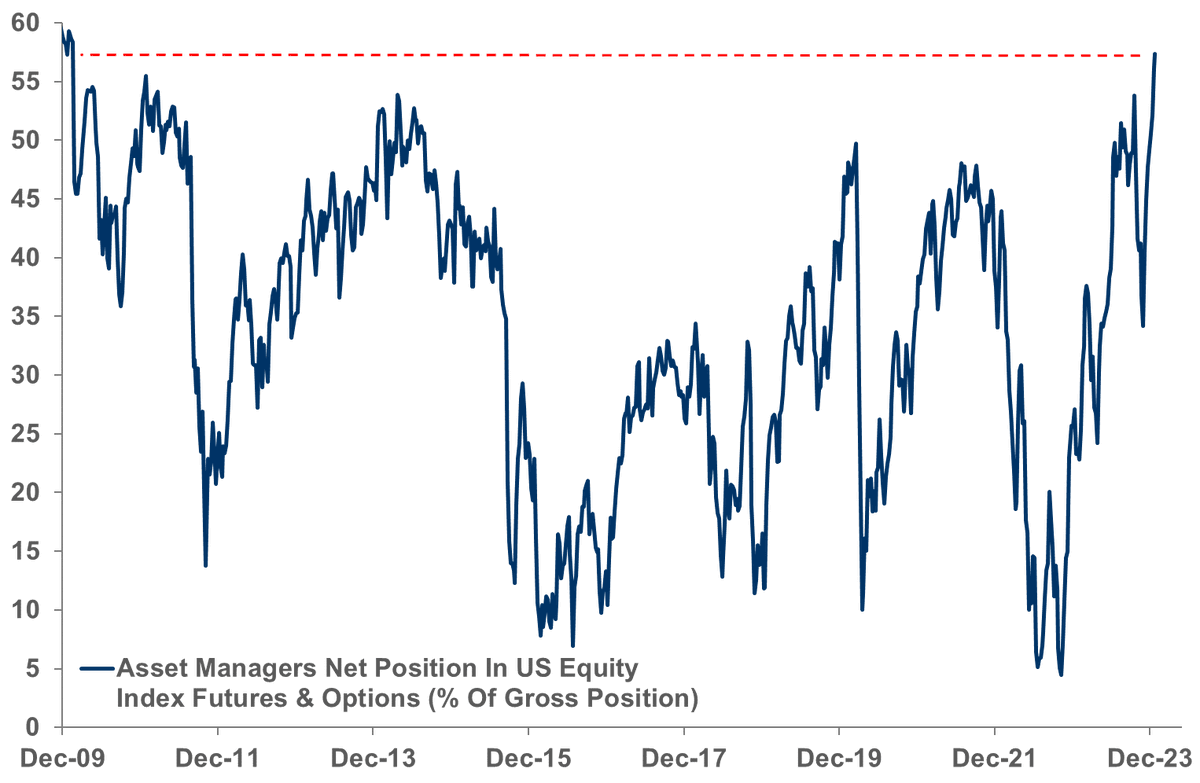
2. Asset Managers’ Futures Positioning: As such, it should come as no surprise that asset managers are heavily net-long stock index futures.
Source: @dlacalle_IA
3. Investment Manager Index: Yet, according to S&P Global’s survey of investment managers, there was a sudden and resolute loss of confidence in the January survey. The biggest drivers of the mind-change was (geo)politics — with Middle East tensions cited in particular (+China/Russia) and US domestic politics (election year) also noted. Expensive valuations were also highlighted as a concern. And fair enough… when you have a market priced for perfection and at the same time a set of very real and credible tail risks on the horizon it makes for a tricky risk outlook.
Source: Investment Manager Index
4. Fund Flows: On a separate note, cumulative retail fund flows (into US equity ETF and mutual funds) appear to go through cycles of doubt and hype (or fear and greed, disbelief vs belief). We are currently in the doubt phase, but with a glimmer of an impending shift into hype mode.
Source: Topdown Charts Topdown Charts Professional
5. Market Cycles: This was one of my favorite charts of 2023, it shows the market cycle from the lens of equity capital markets. IPO activity spikes and climaxes at the peak of the market cycle as ample liquidity, risk appetite, and high valuations entice companies to come to market. And then when markets crash or move into bear market mode, IPO activity dries up. So this chart brings important medium-term market timing information — just by virtue of gauging the stage of the market cycle, but also in that it tells us stuff about the supply side (more IPOs = more supply of equities, ECON 101 says more supply = price go down, ceteris paribus, and vice versa).
Source: My Favorite Charts of 2023
6. Bullish Broadening? This is a particularly interesting chart and gives nod to a few potential candidates for a more structurally bullish outlook for equities.


