
Weekly S&P500 ChartStorm - 13 November 2022
This week: equity technicals, crypto-crisis fallout, sentiment, positioning, surveys, election vs market cycles, earnings recession outlook, fund flows, stocks vs bonds, emerging markets...

Welcome to the Weekly S&P500 #ChartStorm — a selection of 10 charts which I hand pick from around the web and post on Twitter.
These charts focus on the S&P500 (US equities); and the various forces and factors that influence the outlook - with the aim of bringing insight and perspective.
Hope you enjoy!
1. Lining Up: The market gapped up cleanly and ferociously through that 3900 level. Now its next test is looming: the 200-day moving average and that downtrend line tracing the previous sequence of highs.
We know the narrative that helped it breakout (CPI coming in positive, but cooler than expected - prompting pivot postulations), makes me wonder what story we might tell once it reaches resistance... markets have a habit of finding excuses to do what they are technically ready to do!

Source: @Callum_Thomas
2. Crypto Crisis: Seems like “tradmarkets” (traditional markets) are largely shrugging off the crypto crisis. In case you live in a log cabin and only come to town to read the chart storm, this week saw another crypto-crisis flare-up, with one of the largest exchanges/crypto hedge fund/black boxes blowing up (FTX).
I referred to the action in crypto/SPACs/meme stocks back in 2020/21 as whirlpools and eddies around the main current (which was massive stimulus — a global tidal wave of liquidity); basically a procession of mini-bubbles. And I again refer to this as whirlpools and eddies around the main current — global coordinated and near-panic policy tightening (the liquidity tides now receding). I would expect more bodies to float to the surface as the cycle plays out.

Source: @topdowncharts
3. Moved Investors: The TD Ameritrade "Investor Movement Index" shows investor movements nearly on par with the depths of 2020 💩
Source: Investor Movement Index
4. The IMI: Meanwhile, the Investment Manager Index is still about neutral (interestingly, risk appetite has steadily moved higher across the year). Looking at the detail of the survey, the biggest source of perceived improvement across the year has been valuations (from expensive to neutral/reasonable), and more recently the global/macro/political backdrop (getting slightly less awful).
n.b. this survey was taken 2-7 Nov (i.e. before the CPI euphoria)

Source: Investment Manager Index
5. Dysphoria: Another one, the “Euphoriameter” — ticked up slightly in October off of the lowest point since 08/09. Contrarian bull signal?

Source: @topdowncharts
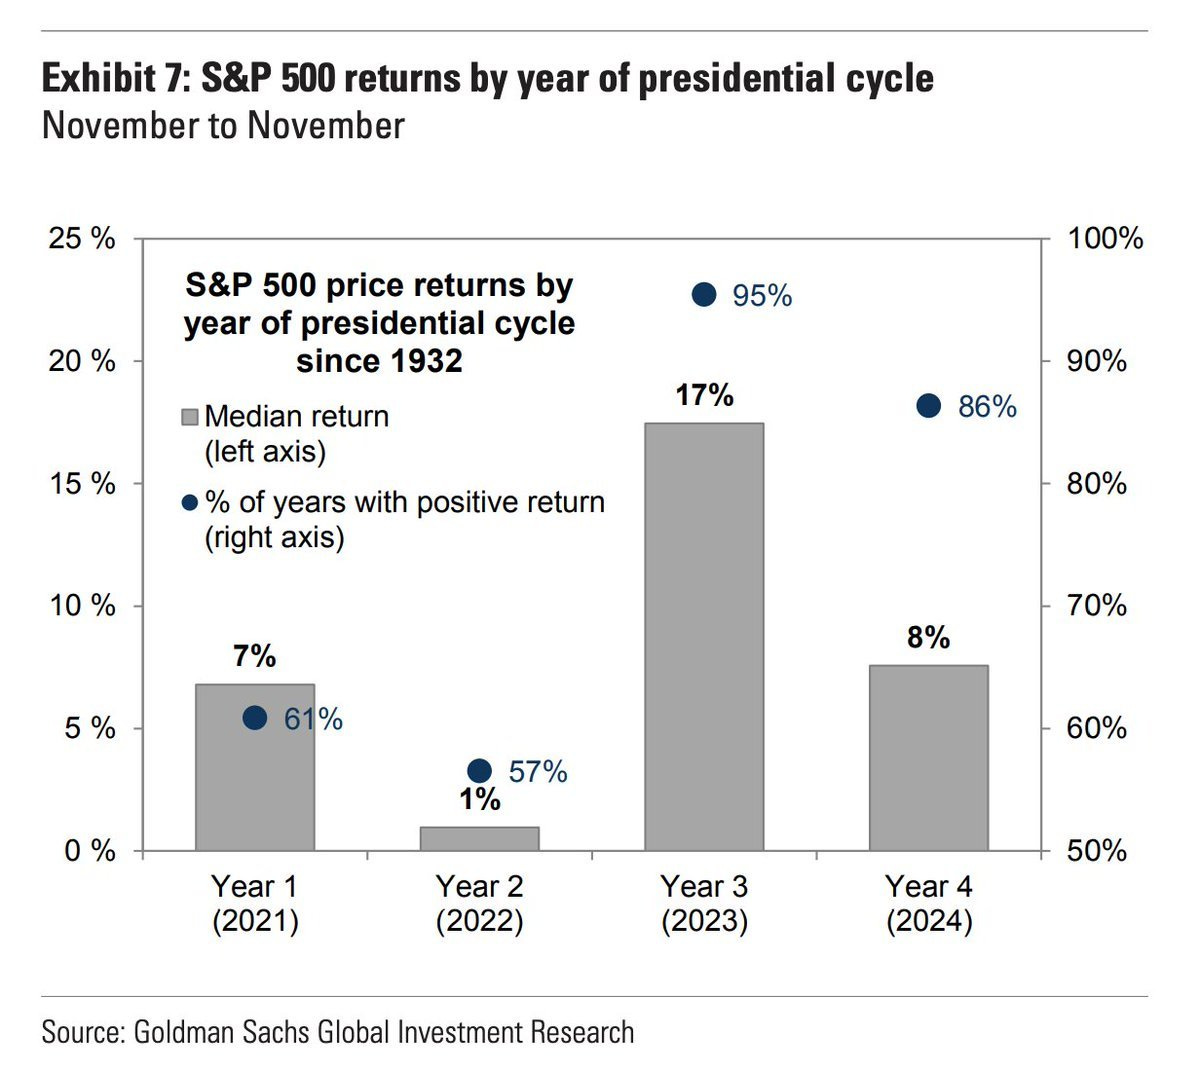
6. Election Cycling: Statistically speaking, year 3 (2023) usually sees the best performance of the Election Cycle [Nov-to-Nov].
“95% of the time it works every time” 🤪 (too bad if we are on the 5% timeline!)
Source: @Mayhem4Markets
7. Lend Me Your Ear(ning)s: Bank loan officers greater chance of saying "no" 🚫🙅♂️ = greater chance of earnings recession...
I talked about this the other day with regards to Commercial Real Estate — banks are really starting to tighten up the criteria and conditions by which they make lending decisions (and reporting weaker demand for loans). This is what you typically see going into a downturn.

Source: @AlessioUrban
8. Flow With the Go: Fund flows show outflow no-show.

Source: @ISABELNET_SA
9. European Cyclicals vs Defensives: Interesting follow-on, European investors appear to be very bearish on cyclicals vs defensives... seems like Europe has been much faster and resolute to adjust portfolios vs the rest of the world. Maybe that’s something to ponder looking forward.

Source: @JohnPlassard
10. Stocks vs Bonds: The ASR global stocks vs bonds indicator is saying 2 things:
-there’s a long way to go in the equity bear market
-odds are massively in favor of bonds beating stocks in the coming months/years

Source: @IanRHarnett
BONUS CHART >> got to include a goody for the goodies who subscribed.
Emerging Market Equity Technicals: something interesting is going on in emerging market equities. After peaking in early 2021, the MSCI Emerging Markets index fell -35% from top to bottom in local currency terms (or -42% in US$ terms).
But in recent weeks EM equities have seen a higher low in their 200dma country breadth indicator, and a strong push higher in that indicator from previously oversold levels. It also comes as the index itself turns up from close proximity to its longer-term uptrend line.

I highlighted this chart a few months ago, noting that at the time the chart suggested patience and caution, but now things are looking quite different, even promising.
At that time I noted “I will be looking for improved technicals (not yet), more compelling valuations (not yet), more fulsome washout in sentiment (not quite), and a shift in the macro currents (also not yet).“
We have here improved technicals. I’ve also noticed that valuations have improved a lot for EM, and similarly EM investor sentiment is looking a bit more washed out. As for the macro, the initial weakening in the US dollar is positive, but it is fair to say it’s still choppy waters on the macro front.
So an interesting development in the context of all that’s going on, and a solitary snippet of cause for cautious optimism, and one to keep an eye on as things unfold and opportunities emerge.
—
Best regards,
Callum Thomas
looking forward to 2023!
good stuff.