Weekly S&P500 ChartStorm - 13 June 2021
Your weekly selection of charts...
Welcome to the Weekly S&P500 #ChartStorm (by email!)
The Chart Storm is a weekly selection of 10 charts which I hand pick from around the web (+some of my own charts), and then post on Twitter.
The charts focus on the S&P500 (US equities); and the various forces and factors that influence the outlook - with the aim of bringing insight and perspective.
Hope you enjoy!
1. Market Breadth Signals: This chart features once again, this time because the short-term breadth indicator has broken down through my “arbitrarily drawn trendline“. By itself that is an interesting development, but what also stands out is the bearish divergence (market edging higher, breadth edging lower). I would say short-term downside risk is elevated until this gets resolved.
Source: @Callum_Thomas
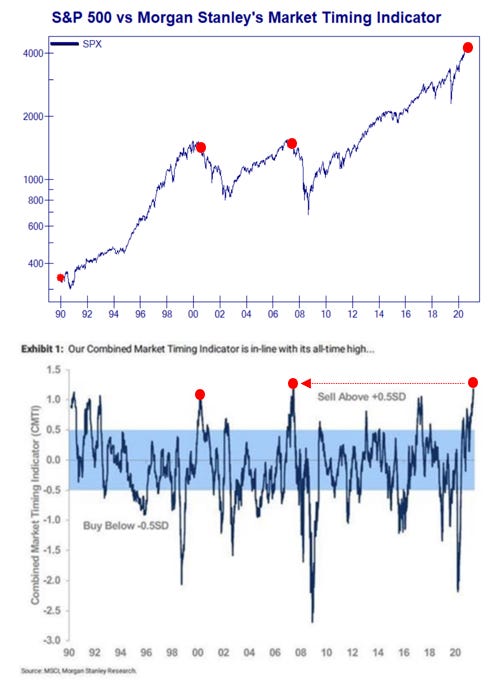
2. Morgan Stanley Market Timing Indicator: I have no idea what’s in this, so I can’t really comment much except to say with n=2 it looks kind of bad. But again, n=2 so let’s consider it, but equally not overweight this signal.
Source: @Not_Jim_Cramer
3. Credit Suisse Fear Barometer: Again, I have no idea what’s in this (I could guess though). But anyway, it looks as though at these levels there is a lack of fear (I deduce this by noting behavior of the indicator at the depths of the March 2020 panic). I guess one takeaway is that it’s surpassed/similar levels as pre-crash 2020. Complacency?
Source: @TheOneDave
4. Median Short Interest: There is little interest in shorting! Hard to be short in this market (unless we’re talking long/short i.e. short one stock, long the index, or long a different stock). But anyway, another sign O the times.
Source: @jmanfreddi
5. Chinese Tech Stocks: I would argue the outlook for US tech stocks is not exciting, but the outlook for Chinese tech stocks is not great at all if this relationship holds... Frankly I think Tech has had its day in the sun: 2020 brought forward a lot of growth - hard to replicate that short-term, and hefty valuations.
Source: @RothkoResearch via @MichaelaArouet
6. Crowdedness! Interesting pair of charts which show the degree of crowding or interest by the buyside (funds) and the sell side (investment banks). Another sign of the lopsided nature of the current market.
Source: @MichaelKantro
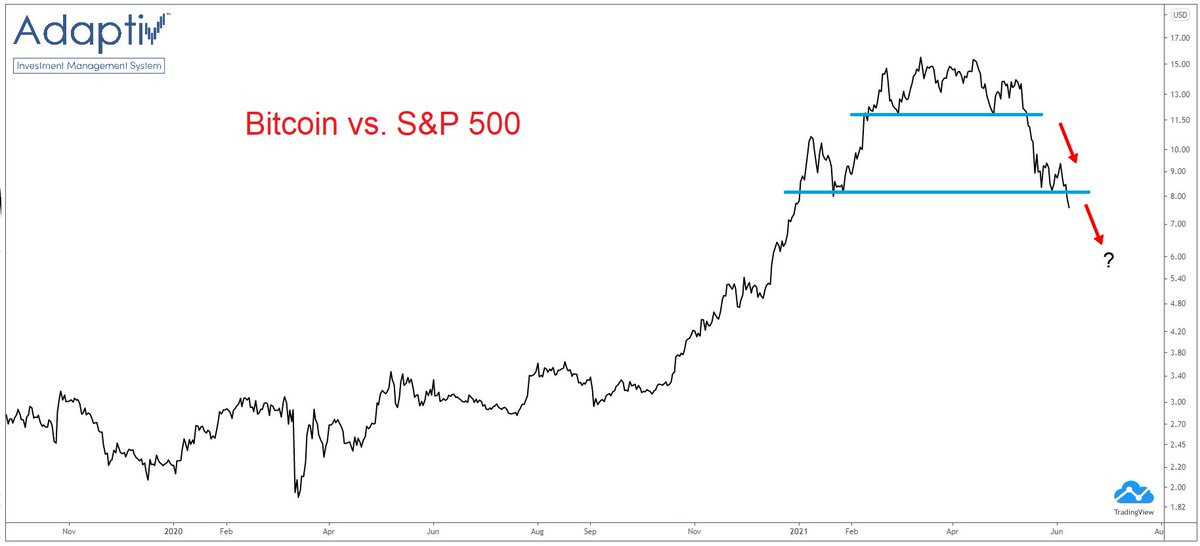
7. “Stocks vs Blocks“ The S&P500 vs Bitcoin relative performance line has breached a key technical level... Path of least resistance in this type of scenario is lower (expect stocks to beat blocks at least in the near term).
Source: @the_chart_life
8. Tax Talk: In case you missed it, the G7 have been making a lot of noise around agreeing a global minimum corporate tax rate of 15%. As you might guess, certain countries probably won’t want to get involved! But the key point for markets is US equities are a bit exposed if the G7 really pushes on with the proposed global minimum corporate tax rate. Notably: "40% of US IT companies pay less than 15% tax". If they are forced to top-up their taxes this means lower post-tax earnings aka headwind to EPS.
Source: @DuncanLamont2
9. Global Tax Trends: Following on, it’s interesting to note how US listed companies' effective tax rate is materially lower vs the rest of developed markets. Even lower than EM! Expect an end to this trend... (and an end to the previous tailwind for earnings of near consistent falling effective tax rates).
Source: @topdowncharts Weekly Macro Themes Report (source)
10. Fund Manager Performance: It’s a stock-pickers market!
Source: @FT
Thanks for following, I appreciate your interest!
oh… that’s right, almost forgot!
BONUS CHART >> got to include a goody for the goodies who subscribed.
Capex Comeback: I thought this one was worth sharing - it shows capex growth for S&P500 companies (excluding commodities), and things seem to be turning the corner.
I’ve added consensus forward earnings growth, which as it turns out is a good leading indicator (as you might expect, since capex decisions and implementation tend to be a bit laggy). Looking at that as a leading indicator, it looks like capex is about to come back in force.
From a macro standpoint we should expect a bounceback in capex as projects disrupted and delayed by the pandemic get reactivated, and as improving demand and cheap funding costs improve the math.
Thematically it’s also very interesting: for US corporates obviously there has been the souring of US-China relations, which may result in some onshoring of manufacturing. But perhaps one unintended side-effect of the pandemic is the massive and worsening supply chain disruption situation. We’ve found out how fragile the global supply chain is, and it wouldn’t surprise me to see firms investing more in domestic production simply for resilience purposes.
The other aspect is the short-term crunch of inventory shortages and price spikes: together these will likely prompt some firms to boost capital spending.
Another short-term theme is the labor shortages - that along with talk on higher minimum wages and generalized wage pressure could raise focus on automation and investing in machines vs people.
So whatever way you look at it, capex is set to make a major comeback.
—
Best regards,
Callum Thomas
SPONSOR: ( …he’s me!) My research firm, Topdown Charts, has a new entry-level Substack service, which is designed to distill some of the key ideas and themes from the institutional service to provide the same high quality insights at a more accessible price.
Give it a try and let me know what you think


