Weekly S&P500 ChartStorm - 11 Feb 2024
This week: 5k and 50 days, financial conditions, speculative sentiment, credit spreads and the VIX, valuations, stocks go up, fund manager track records, GSV vs ULG...
Welcome to the latest Weekly S&P500 #ChartStorm!
Learnings and conclusions from this week’s charts:
The S&P 500 finally crossed above the 5000 level.
A number of short-term risk indicators are lighting up (sentiment, breadth, financial conditions).
Valuations are also getting elevated as confidence surges.
Credit spreads and the VIX meanwhile are complacent, calm.
In the long-run, stock prices go up (albeit the long-term is simply a collection of many short-terms).
Overall, there are ample bullish signs, signals, and stories. And indeed, in the long-run, historically at least, stocks go up. In the current short-run, there are some fairly clear risk flags waving. I don’t do crash-call clout-chasing, but I do like to call out the evidence and present thought provoking charts. And there some very thought provoking charts and growing evidence to say pay closer attention to risk management in the coming weeks and months.
1. 5k and 50-days: We made it — 5000 on the S&P 500! I don’t want to go and invoke silly terms like roundnumberitis, but I would like to highlight that the 50-day moving average breadth indicator has rolled over from overbought. It’s not a perfect signal, as you can see for yourself in the chart, but the last 3 times it did that it worked fairly well as a short-term risk signal.
Source: @Callum_Thomas using Market Charts
2. FinCond Quibbles: And that short-term risk signal comes as bond yields + USD + crude oil prices are all ticking slightly higher.
While what drives the market is constantly changing, the move in these 3 elements reinforced/triggered the weakness in stocks in Aug-Oct last year (or aka: financial conditions tightening), and the subsequent rebound (financial conditions easing). So these macro divergences are something worth keeping an eye on.
Source: Callum Thomas using StockCharts
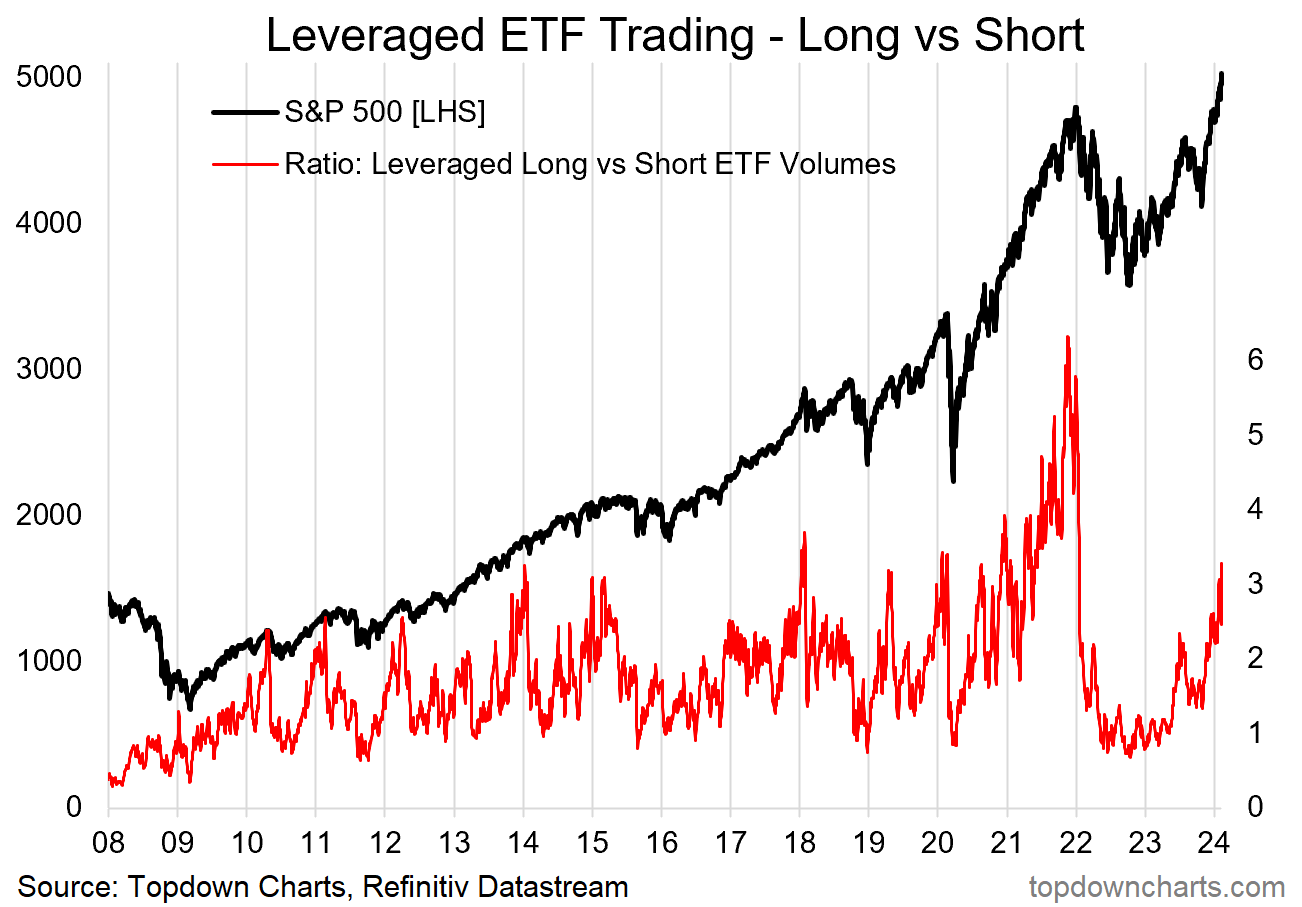
3. Frenzy Again: Especially as greed and frenzied speculation returns.
The chart below shows trading action in leveraged long vs short equity ETFs — the higher it is the more bullish speculation there is.
Source: Topdown Charts Topdown Charts Professional
4. All is Calm: Complacency is taking hold as credit spreads push down to the bottom end of the range and the VIX slumbers.
Source: Weekly Macro Themes - 9 Feb 2024
5. Invaluable: Meanwhile, valuations are back to expensive. Not quite at the extremes, but high enough to heighten the risk management senses. Also, taken by itself this chart is one thing, but taken alongside a few other risk flags, it’s certainly food for thought.
Source: Using Valuations to Navigate the Cycle
6. AM All-In: So, first of all,


