
Weekly S&P500 ChartStorm - 10 May 2026
This week: technical check, equal-weighted S&P500, blow-off tops, asset allocations, passive investing, listed companies, sector skews, space stocks, Bitcoin...

Welcome to the latest Weekly S&P500 #ChartStorm!
Learnings and conclusions from this week’s charts:
The equal-weighted S&P500 has stalled at resistance.
(and the cap-weighted is back to outperforming equal-weighted)
We are potentially in the blow-off top phase of the market cycle.
Investors are all-in on stocks (and all-out of bonds).
There have been several major shifts in market structure.
Overall, the market continues to press higher (lead largely by big tech/AI) and investors in aggregate are all-in on growth and the stock bull market continuing.
Yet there are a few major changes in market structure that investors need to be aware of and some very interesting corners of the market that many are overlooking…
1. Equal-Weighted: while the headline cap-weighted version of the S&P500 is up about 8% YTD and onto new highs, the equal-weighted version has lagged behind (albeit still up ~6% YTD) and has sort of stalled at resistance. This is also reflected in market breadth, with about 43% of stocks tracking below their 200-day moving average.
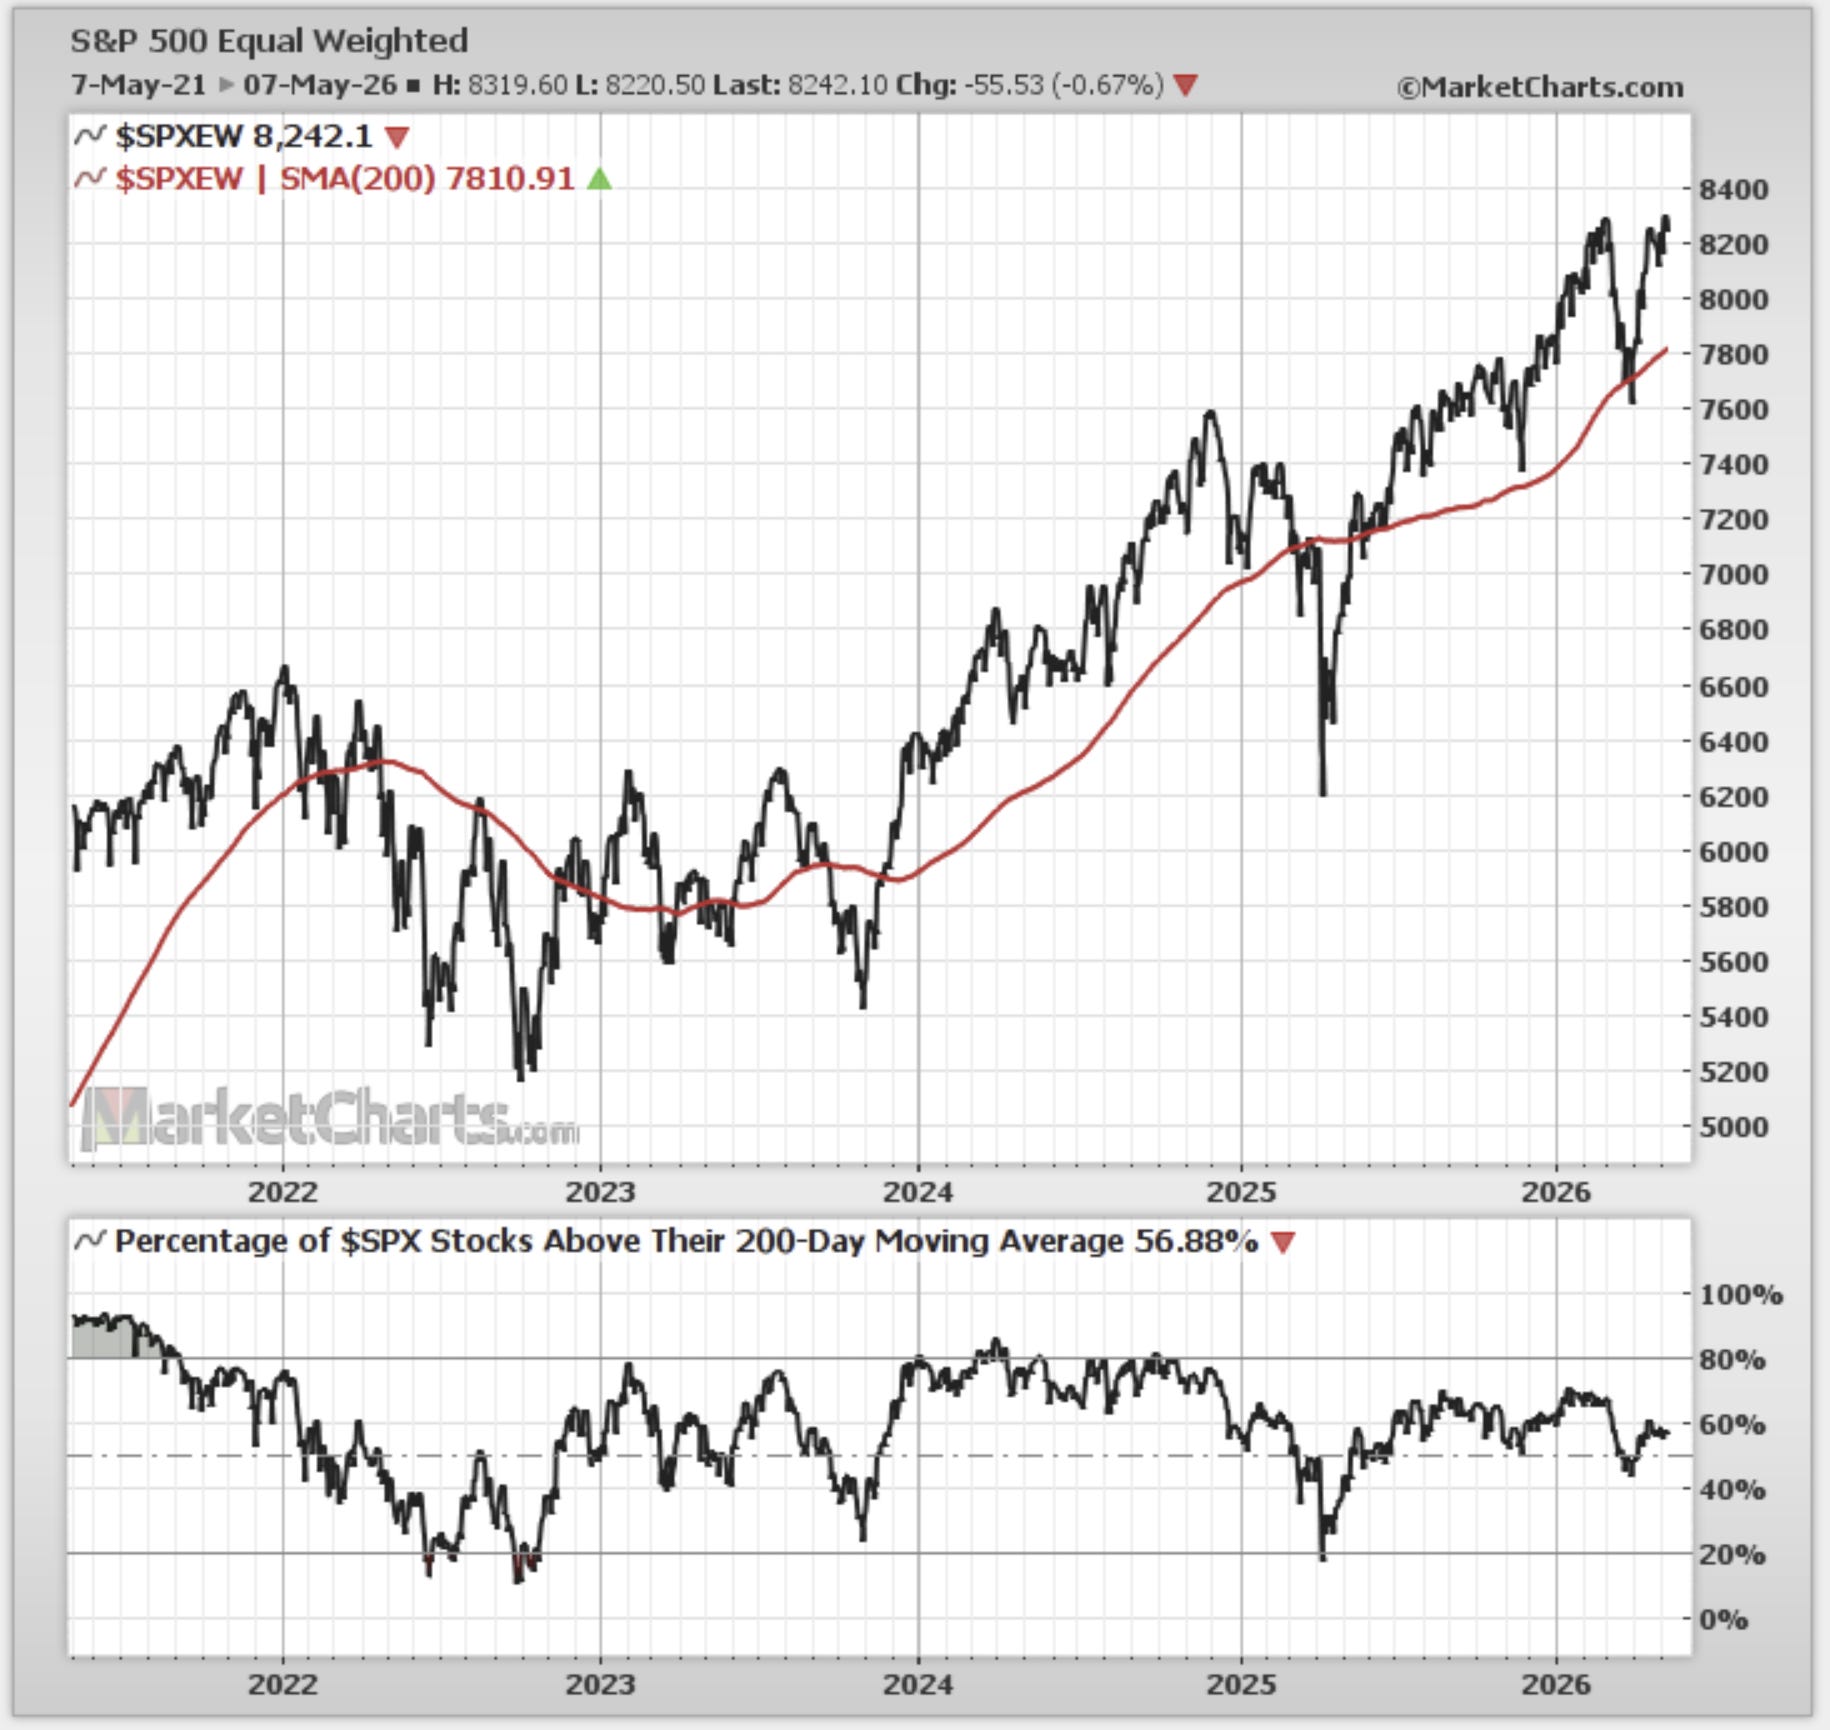
Source: MarketCharts.com
2. Equal-Weight vs Market Cap-Weight: the recent price action also marks an end to the brief rotation in equal vs cap weight, with the heavy-weight big tech/AI companies largely leading the charge. This again sees the equal vs cap weight relative price line moving further away from trend, and providing yet another echo of the late-1990’s.
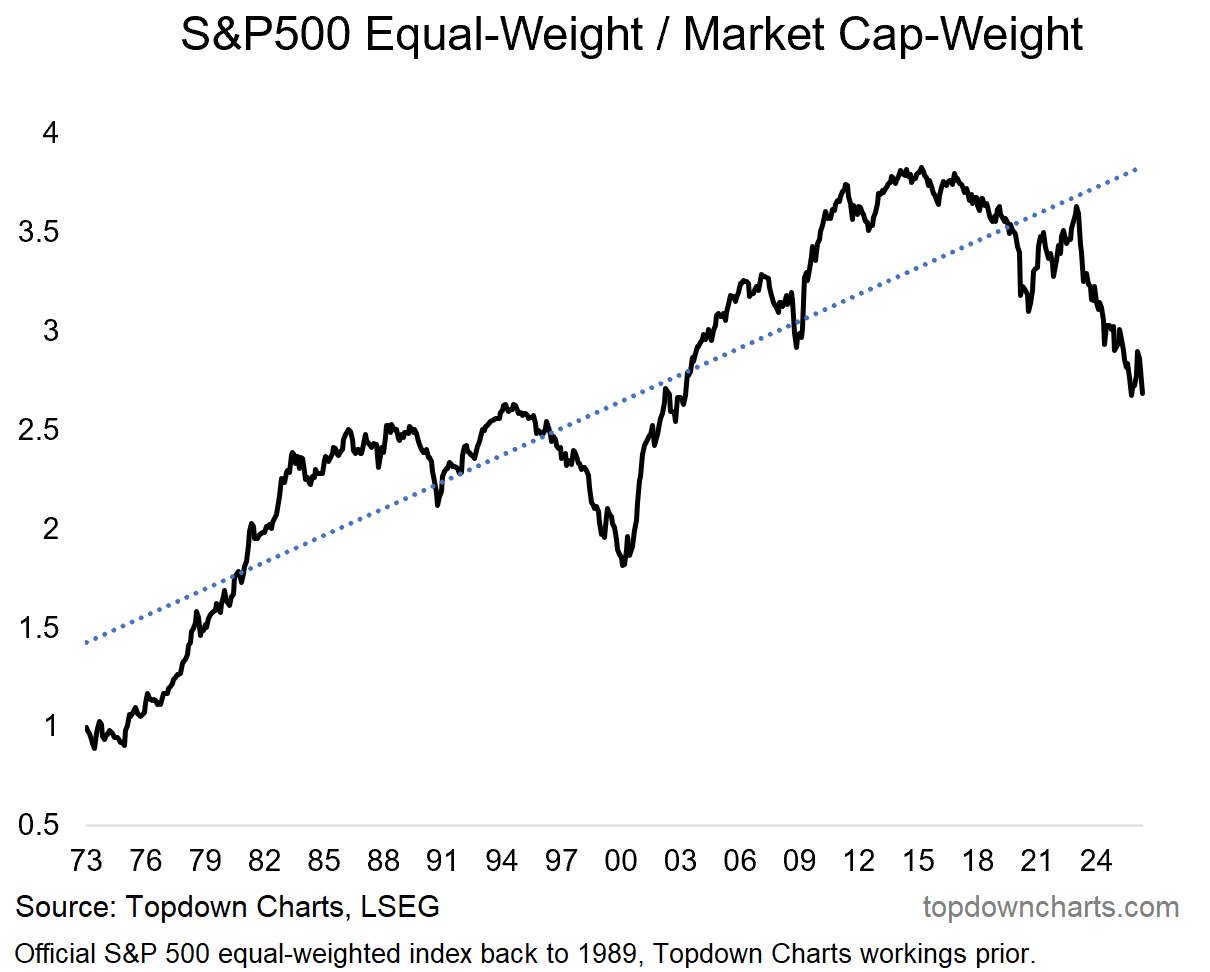
Source: Topdown Charts Professional
3. The Fun Part: speaking of late-1990s, if the below analog chart proves accurate, then this is what some might call the fun part of the bubble — the blowoff top where wild price moves result in profits (which may or may not be followed by pain if the analog proves accurate all the way through!).
