Weekly S&P500 ChartStorm - 10 December 2023
This week: technical check, financial conditions, Fed thinking, stocks vs bonds, jobs, bankruptcies, German stocks, gold, emerging markets, hope for the future...
Welcome to the latest Weekly S&P500 #ChartStorm!
Learnings and conclusions from this week’s charts:
As the S&P500 notches up a new YTD-high, an important overhead resistance zone looms (and the breadth rebound seems to have stalled).
On the upside, financial conditions have broken out (but let’s see what the Fed has to say about that this week).
When the Fed pivots to rate cuts, historically that’s a good time to go overweight bonds and underweight stocks.
German stocks are breaking out to new all-time-highs.
Job openings are ticking lower, bankruptcies higher.
Overall, clearly the momentum remains up-to-the-right, and the path of least resistance sure seems higher (sentiment, seasonality, soft landing) — yet, markets have memory and it will be interesting to see if we can clear that overhead resistance zone (and avoid any potential Fed-induced nightmares before Christmas).
1. Technical Check: Last week we got another new YTD high (clearing the 31 July high, and last Friday’s high). This along with an upward sloping 200-day average is generally a good sign. However, we are now in the process of contending with that major overhead resistance zone (which by the way, saw a number of false breaks on both sides around the turn of 2021/22). The other point to note is that the rebound in breadth has stalled (FYI: defensives and commodity sectors are the weak spots) — contrast that to 2021 where it was a broad-based rally.
Source: @Callum_Thomas using Market Charts
2. Financial Conditions Breakout: One positive is that the Bloomberg Financial Conditions Index has broken out to the highest (most easy/stimulative) point since early-2022. And it has been this sharp turnaround in financial conditions that has fueled the rally in stocks (falling bond yields, weaker USD, tighter credit spreads, lower oil price).
…but. The Fed has its final meeting of 2023 next week, and while the market has already made up its mind that the Fed is done with rate hikes, it will be interesting to see if the Fed gives the OK to this easing — there is the potential they may see it as too much too quick, and seek to talk back some of the easing in financial conditions.
Source: @CameronDawson - Enjoy the Silence: The Fed Next Week and Beyond
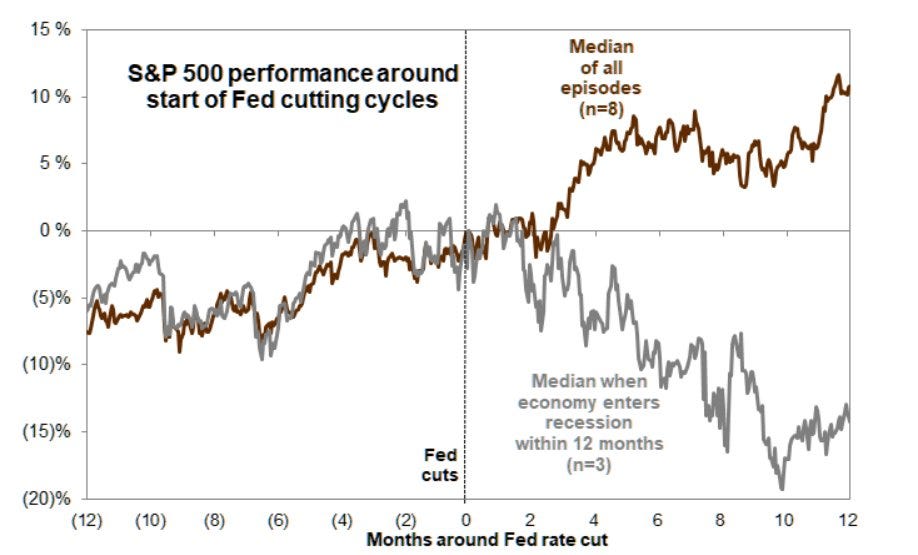
3. If the Fed is Done: Following the 4th month of Fed pauses in November, the market is increasingly focused on rate cuts as the macro sentiment pendulum swings. What that could mean for markets will depend on whether the Fed fine tunes policy in the face of fading inflation (brown line) or whether they are forced into cutting rates in response to recession and/or crisis (gray line).
Source: @Mayhem4Markets
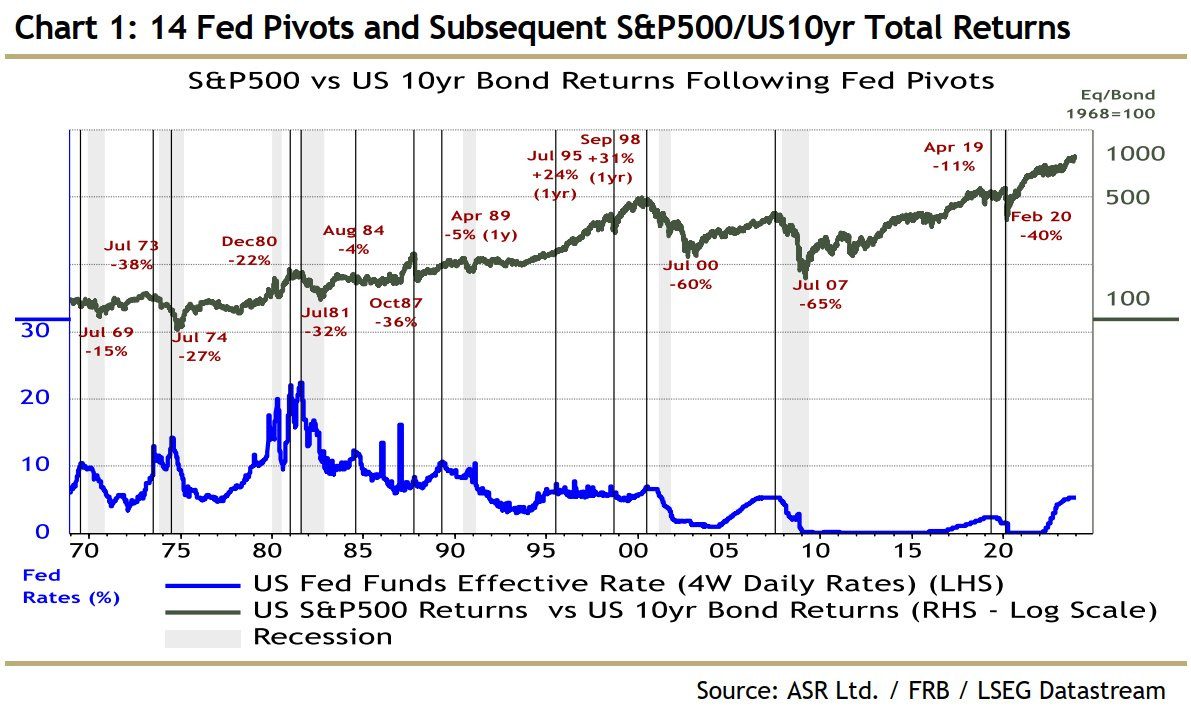
4. Pivot Prospects and Stocks vs Bonds: This chart maps the path of stocks vs bonds when the Fed pivoted to rate cuts. Typically it sends the stock/bond ratio lower, conceptually this makes sense: lower rates are good for bonds, and lower rates are often in response to weaker growth (bad for earnings, sentiment: stocks lower). From an asset allocation perspective if you believe the Fed will pivot to rate cuts then the historical probabilities favor underweighting stocks, overweighting bonds.
Source: @IanRHarnett
5. Stocks vs Bonds — Valuation: All the more so then when you’re coming from a starting point of stocks being stretched vs bonds. Indeed, in the aggregate, US stocks are expensive vs history, expensive relative to bonds, and bonds are outright cheap (albeit slightly less so in recent weeks). Valuation-wise the forward-looking probabilities are in favor of bonds vs stocks.
Source: Chart of the Week - Stocks vs Bonds Topdown Charts
6. No Jobs? No Problem: On first glance this one looks bearish — and if the Fed was dragged into cutting rates, e.g. due to a weakening jobs market, this is exactly the kind of thing you’d expect to see. On the other hand you might argue either that job


