
Weekly S&P500 ChartStorm - 10 August 2025
This week: volatility season, recession unmentioned, earnings beats, profits and profit margin trends (tech vs non tech, big vs non big), leverage, valuations...

Welcome to the latest Weekly S&P500 #ChartStorm!
Learnings and conclusions from this week’s charts:
S&P 500 Companies are no longer concerned about recession.
Q2 earnings season saw a big surge in big beats.
Tech stock earnings are going vertical, non-tech horizontal.
Tech sector profit margins are at a cyclical and secular high.
Strong earnings helped drive valuations to extreme expensive.
Overall, the market continues on in its lane, unbothered. Yet the tendency for higher volatility around this time of the year and the tendency for political/policy surprises all through this year means maybe don’t get complacent. And even as the clearly good earnings data says maybe expensive valuations are justified, there is an important assumption embedded in that, as I will explain…
1. The VIX Script: Curiously the VIX made a brief spike right about when the seasonal map said it would, and then subsequently has also calmed back down right on cue. The implication is that if this seasonal script-following persists then we are in for some heightened volatility in the coming weeks and months.
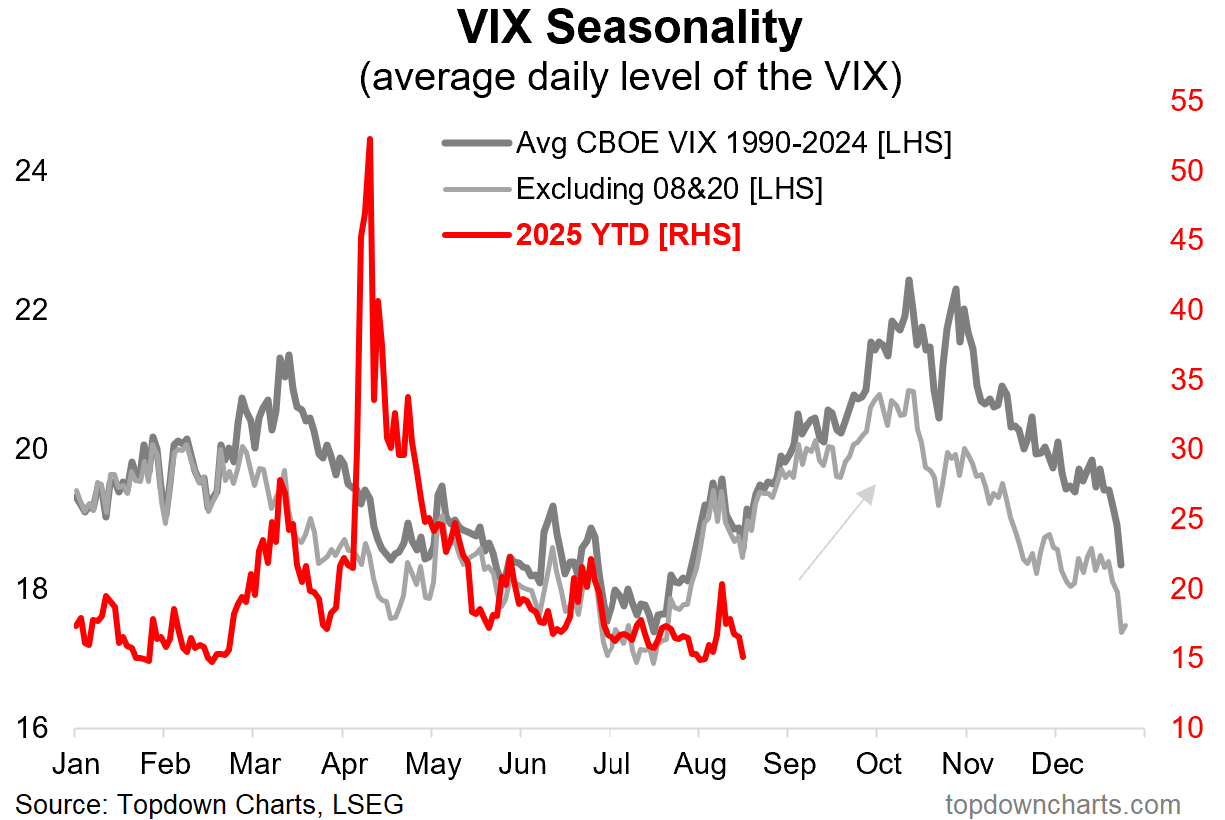
Source: Topdown Charts
2. Recession Receding: On the other hand, while recession talk got a boost amongst macro pundits following the bad payrolls a couple of weeks ago, apparently corporations are a bit more relaxed. We saw a big collapse in “recession” mentions in the latest round of earnings calls. Maybe it’s a sentiment signal, or maybe it’s a sign that things are ticking along OK.
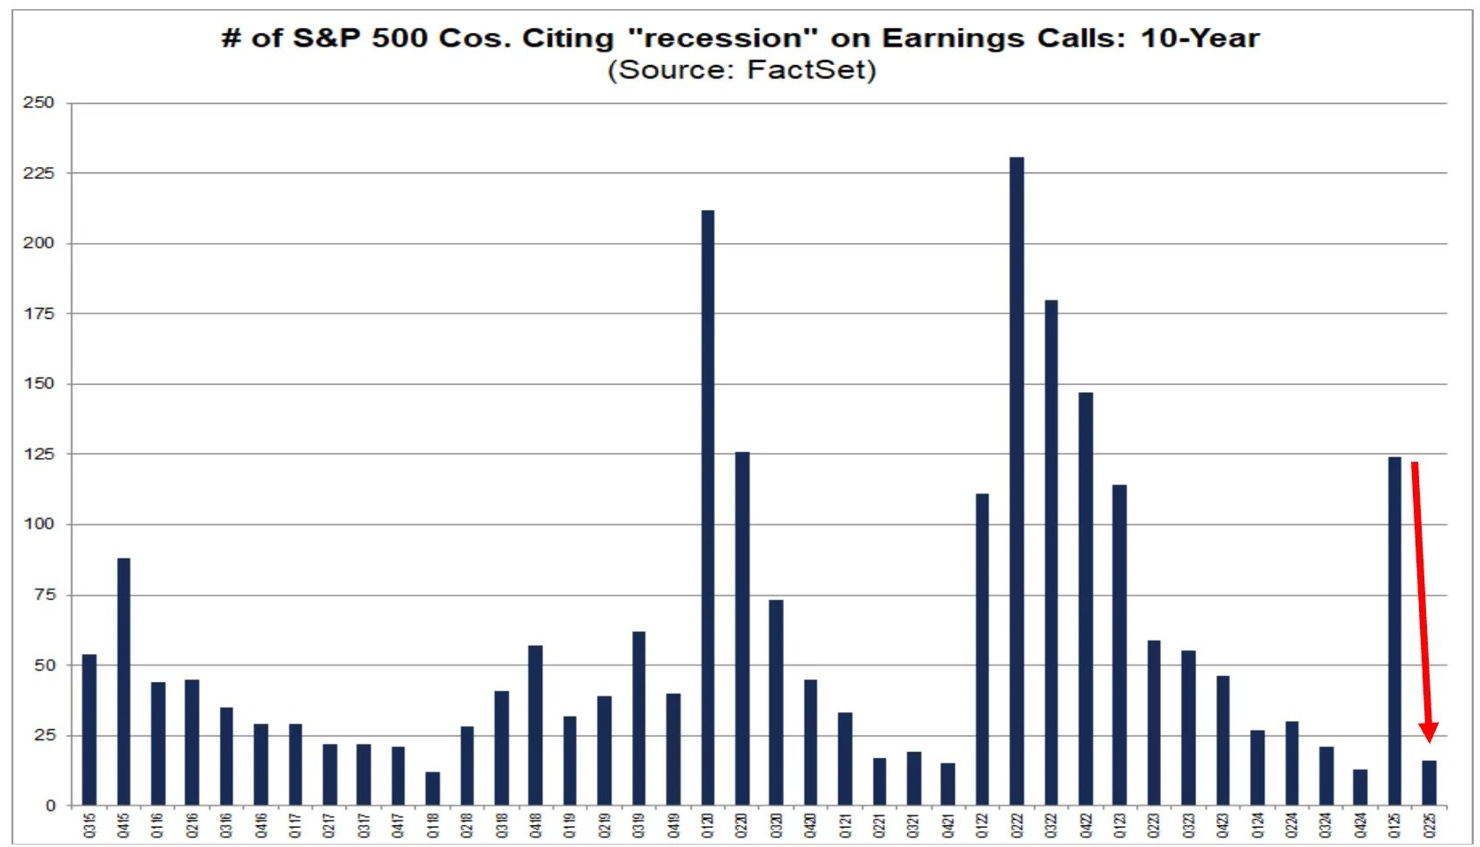
Source: @dailychartbook
3. Earnings Surprise! And if you want something to support that, here’s one interesting stat; 63% of the S&P 500 beat their consensus earnings estimate by at least 1 standard deviation. Now to be fair there is a bit of gaming around earnings estimates (companies talk down prospects to analysts to try lower the bar for outperformance — you can see this potentially becoming more endemic over time with big beats trending up and misses trending lower to sideways). But even still, this is a notable datapoint.
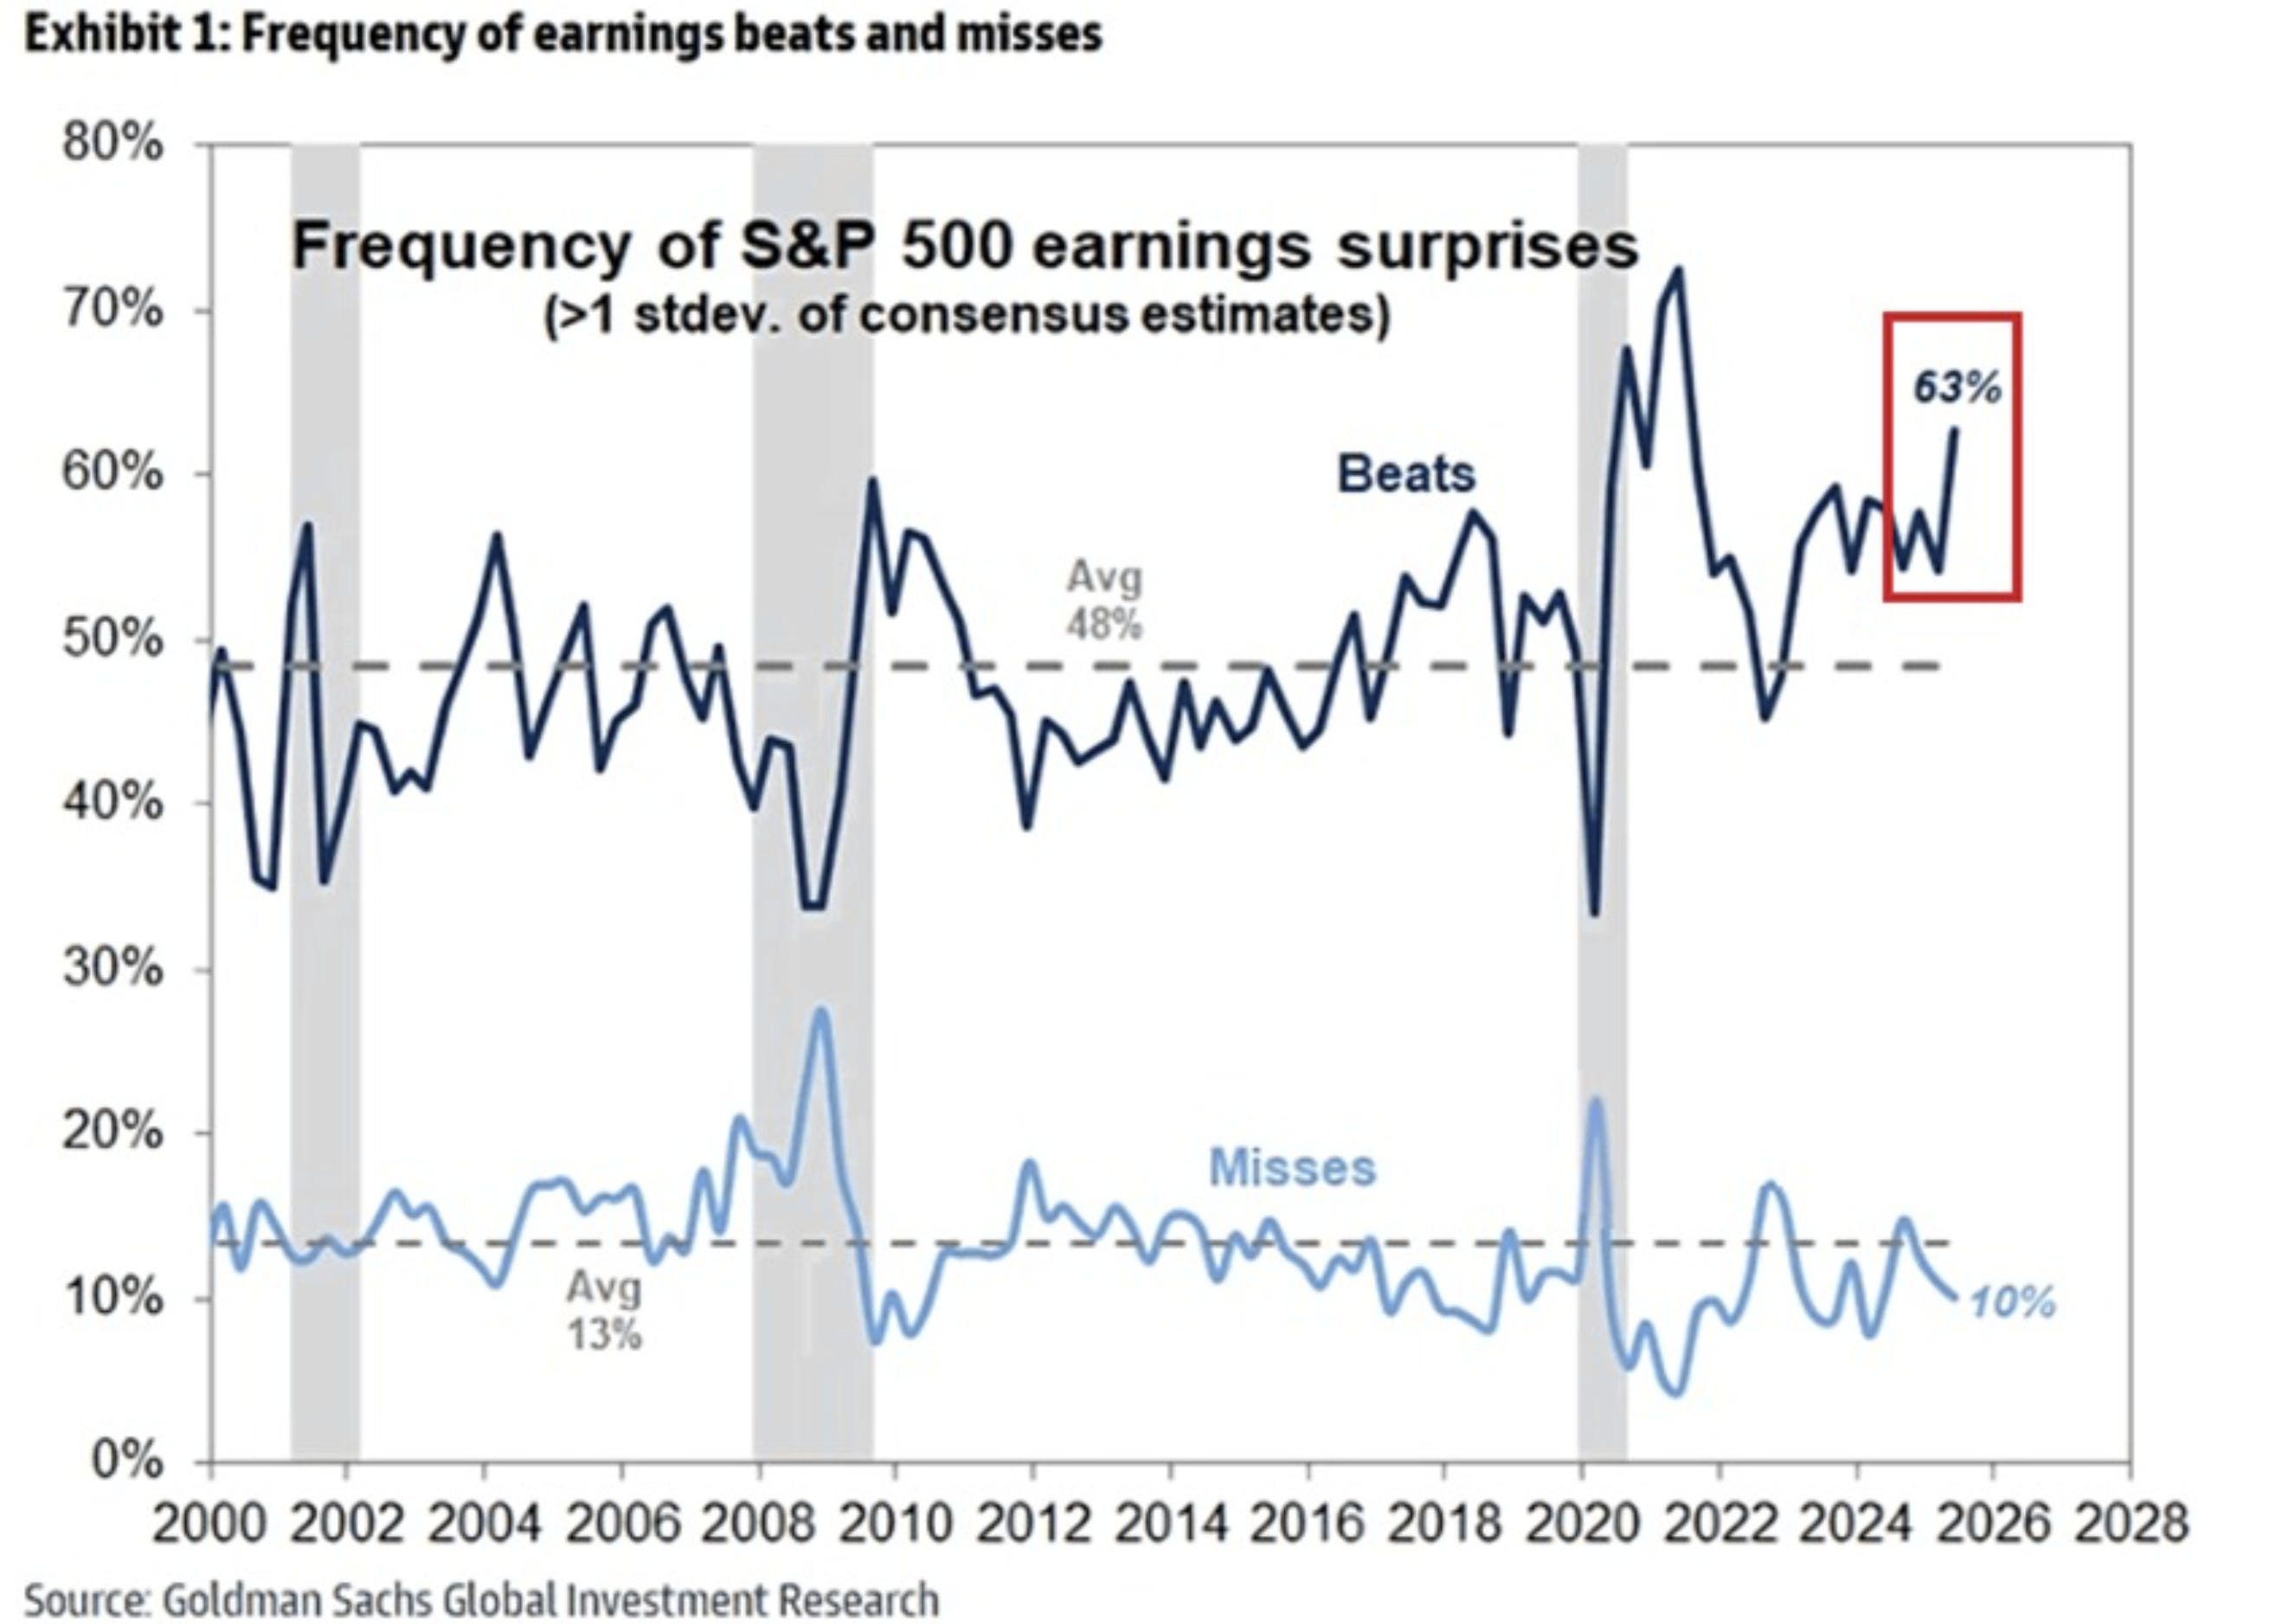
Source: @KobeissiLetter
4. Don’t Miss! Speaking of earnings beats/misses, and kind of corroborating that — those companies who miss their earnings estimates get punished notably. This makes sense; at a time when most companies are beating and beating big, it kind of says something (bad) about your business if you miss… and especially if you miss estimates even if you tried to talk analyst expectations down.
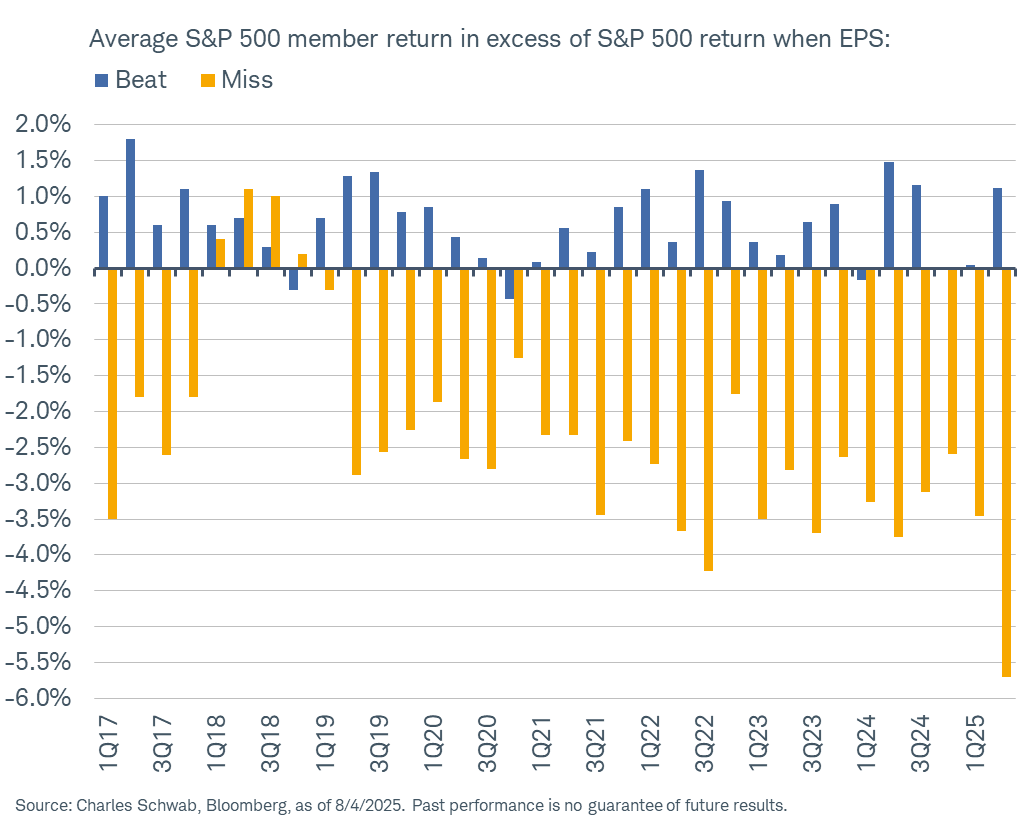
Source: @KevRGordon
5. Earnings — Tech vs the Rest: Staying with earnings, I can’t help but ponder a few questions when I see this chart showing tech stock earnings going vertical and non-tech earnings going horizontal… e.g. how sustainable is that near-vertical climb in tech earnings? when/will the black line catch-up? what will happen to these lines during the next recession? are valuations over-accounting for these recent rends?
