

Welcome to the latest Weekly S&P500 #ChartStorm!
Notes from this week’s charts:
The S&P500 closed October down -0.93% (still up +10.7% YTD).
Meanwhile the equal-weighted S&P500 closed up +4.9% in October.
Midterm patterns and seasonality suggest a strong run ahead for stocks.
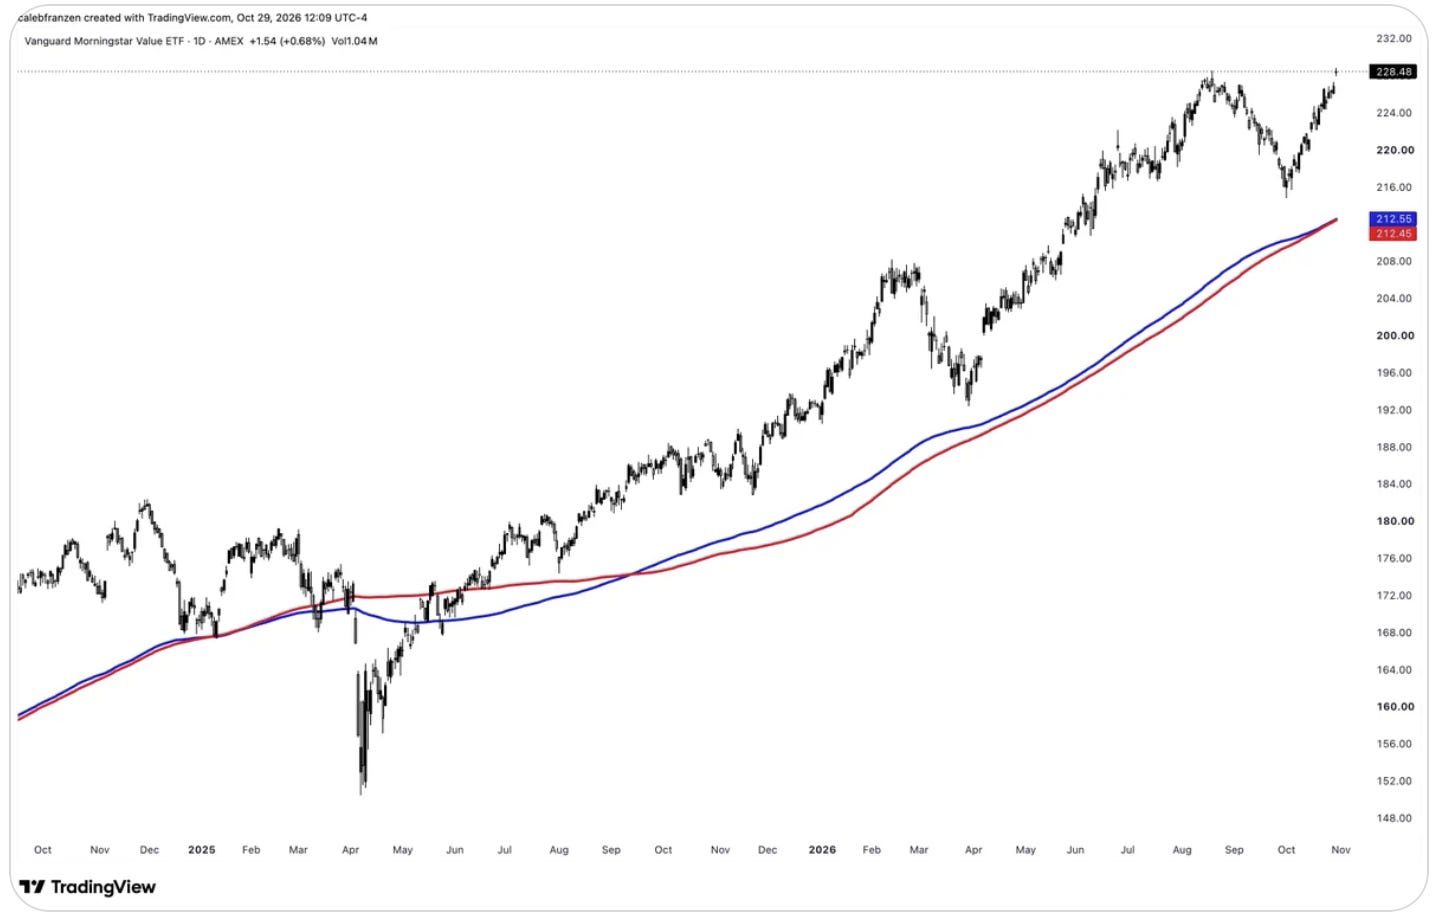
Value stocks are making new all-time highs following the yield correction.
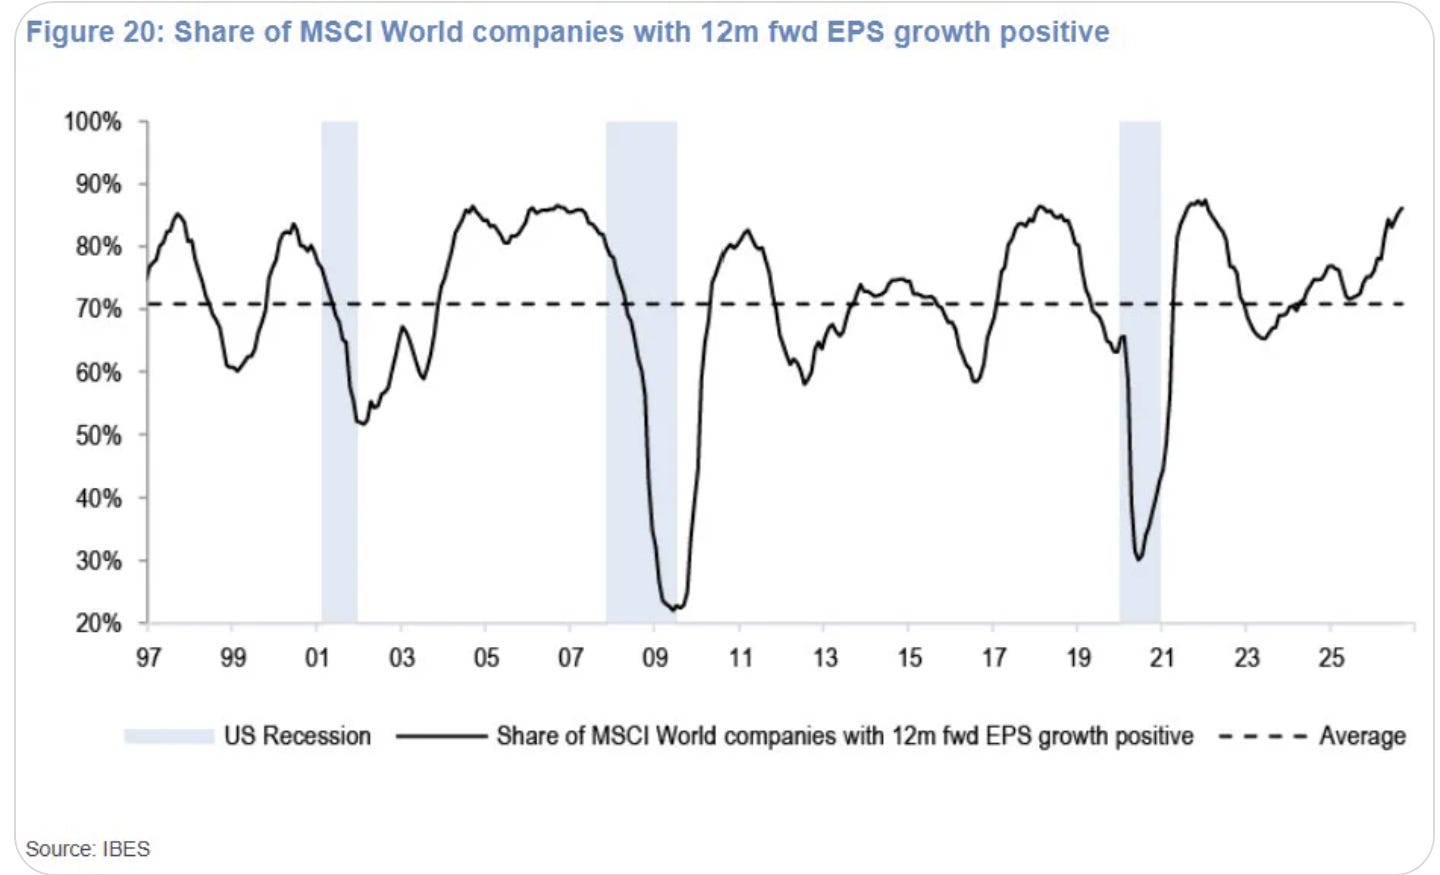
Global earnings breadth is running strong (maybe a little too strong).
See below for the full set of charts and details behind these points + the [new] market outlook section at the end for my latest assessment.
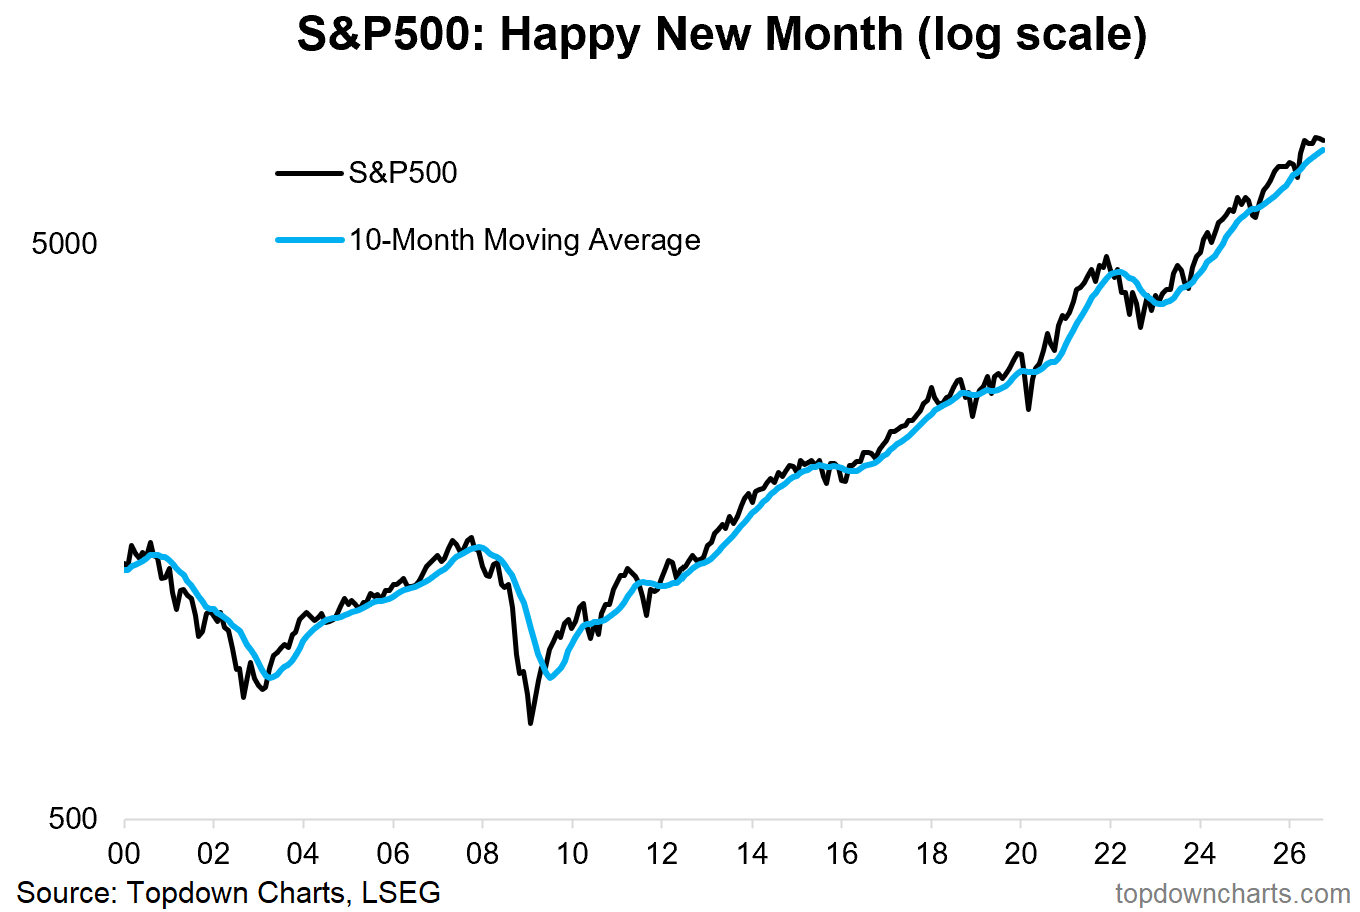
1. Happy New Month! The S&P500 closed October down -0.93% on the month (meanwhile the equal-weighted index gained +4.9%, and Nasdaq off -6.7%), this places it still up +10.7% YTD (11.8% including dividends). With still 2 months to go for 2026 that’s a respectable YTD figure, but the last 5-months have basically been a range trade, and there are a few cracks appearing in the bull market narrative.
Source: Topdown Charts Professional
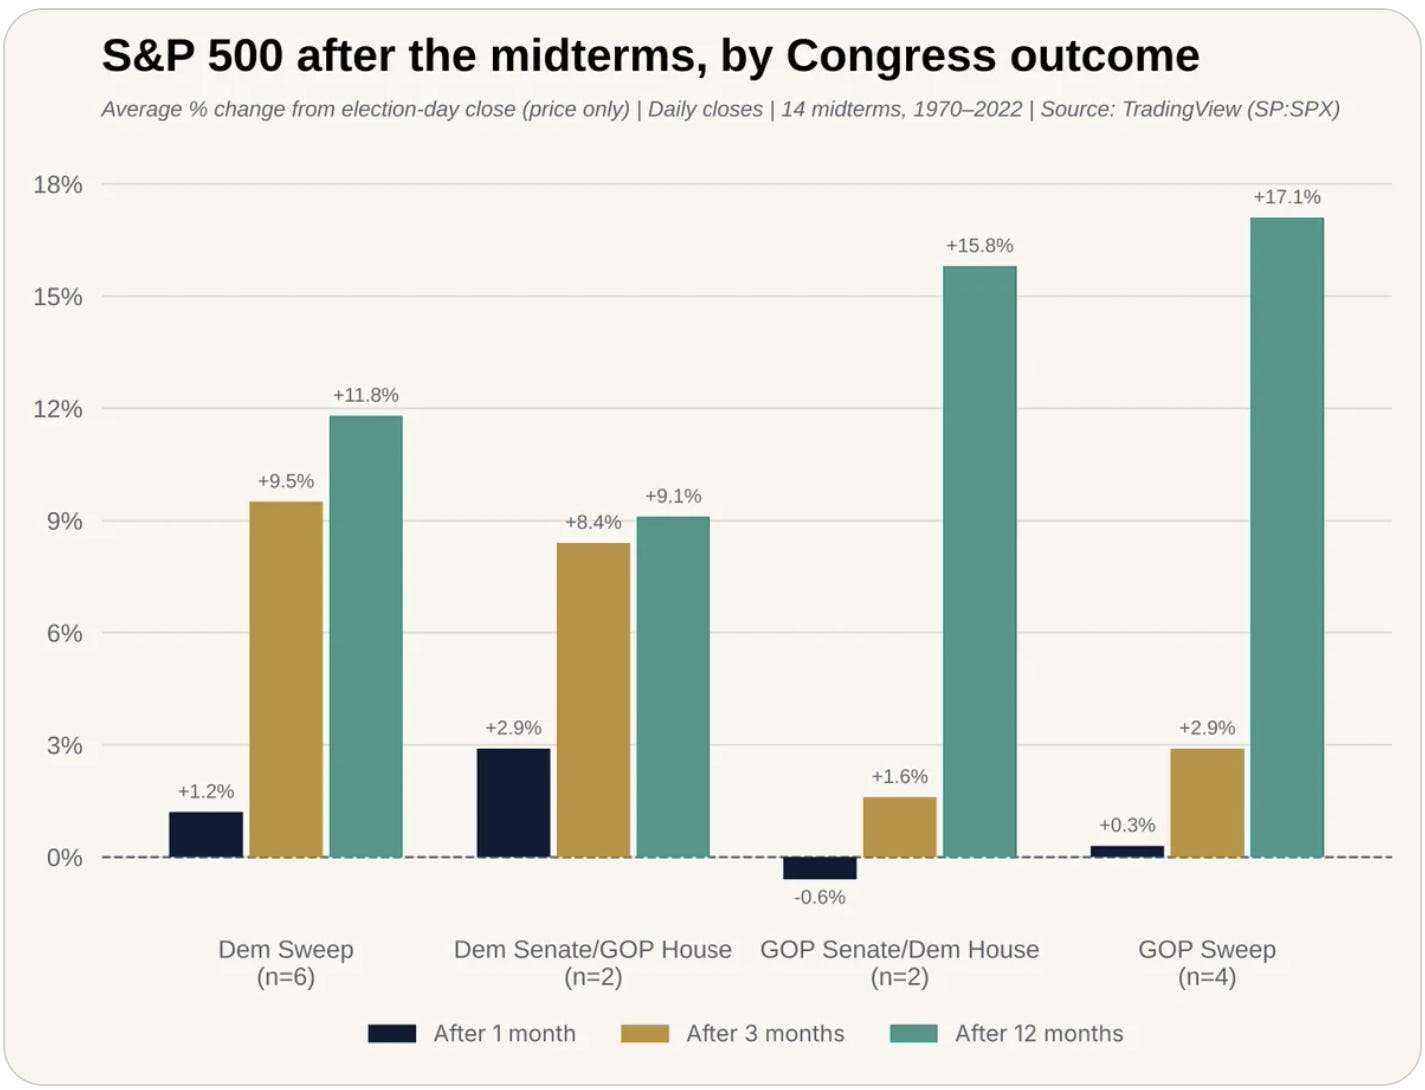
2. Midterm Markets: betting markets are pricing a very high chance of a Dem House, and also fairly high chance of Dem Senate. Interestingly, that outcome has historically produced the best 3-month post-election returns (albeit with the caveat that none of those instances included the Trump factor).
Source: @MrMBrown
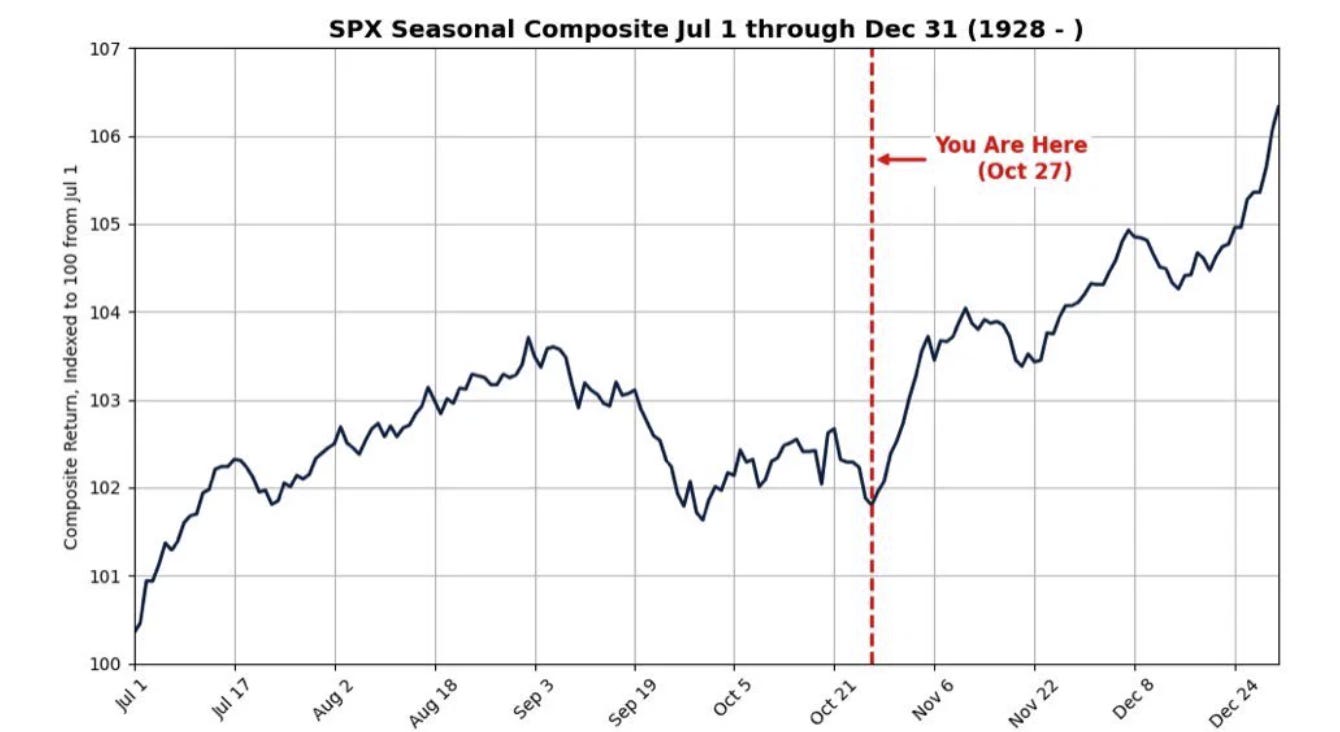
3. Seasonally Sublime: and as extensively covered, seasonality is about to flip maximally positive (though see the next chart for a caveat on this).
Source: @MikeZaccardi
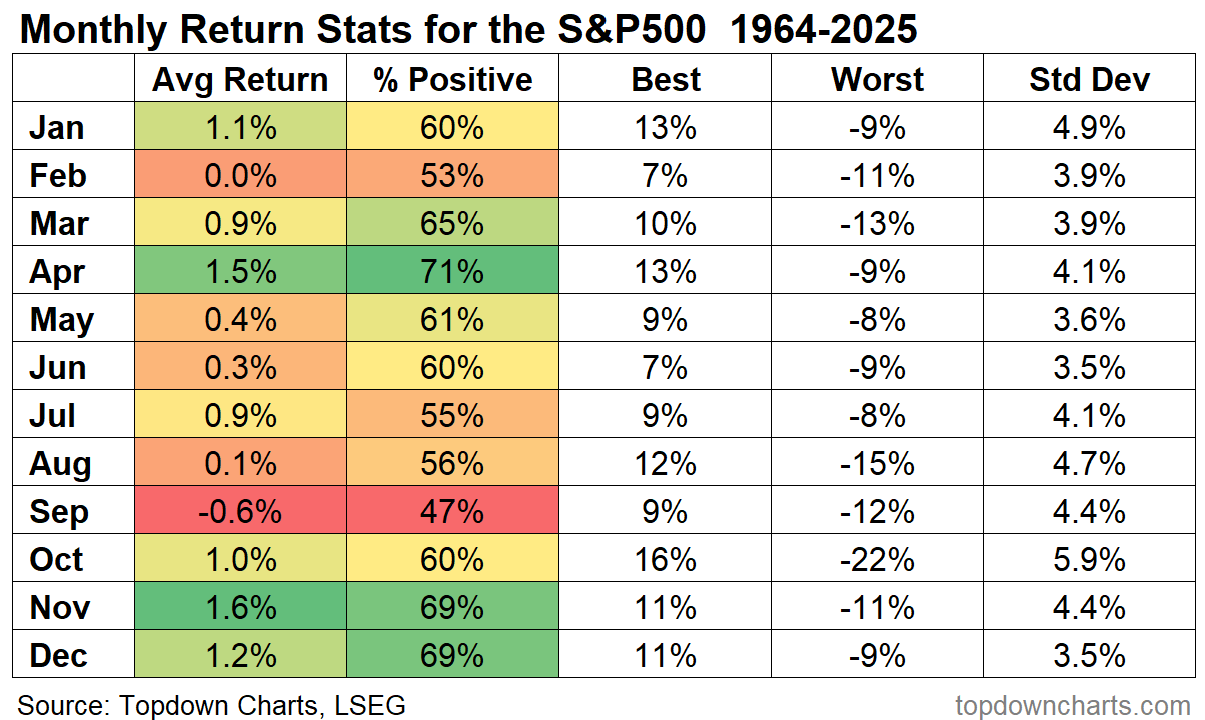
4. Monthly Stats: the monthly seasonality stats are revealing for a couple of reasons. First, November is the best month of the year from an average return standpoint and second-equal on % positive (historical 69% probability the market ends November up). Second, notice the best vs worst Novembers in history: +11% vs -11% (and then also contemplate that 31% of Novembers were negative).
There is a seasonal edge for November (and December), but anything can happen to throw that off, and statistically there is almost a third chance that the market closes down. Be open to upside, but don’t rely on this as your only guide.
Source: Topdown Charts Pro
5. Value Stock Index: meanwhile value stocks (VTV) are out to new all-time highs. This follows a largely yields-driven correction in Aug/Sep, which reversed in October with the peak in bond yields.
Source: @CalebFranzen
6. Global Earnings Breadth: in other good news, the percentage of companies globally with forward earnings expanding on a year-over-year basis is at multi-year highs.
Source: @BlakeMillardCFA
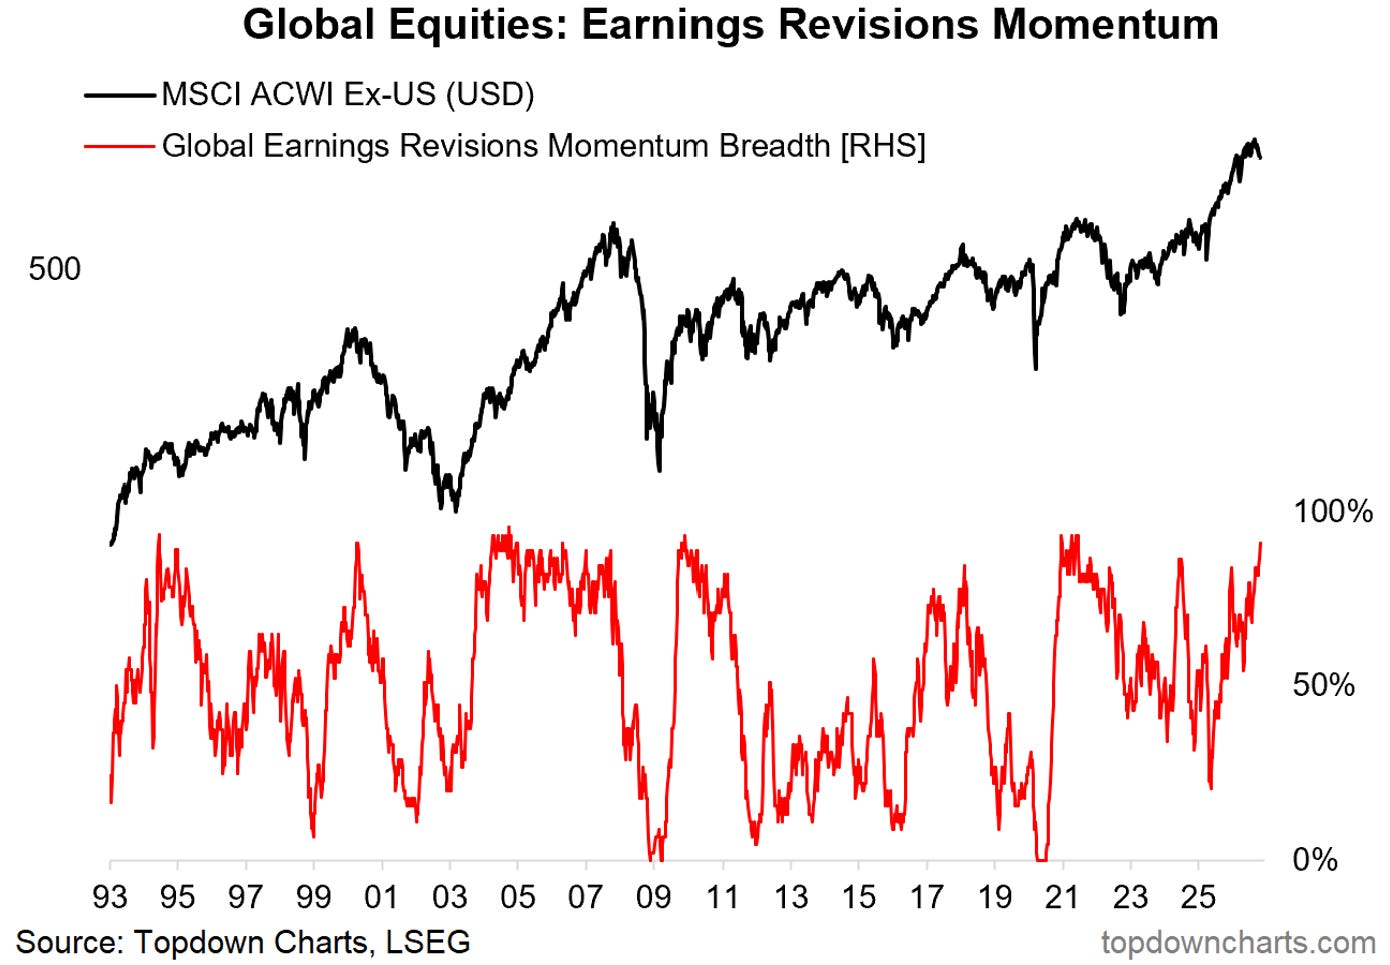
7. So Good, it’s Bad? but as I mentioned the other day, there is such a thing as “so good that it’s bad”. Earnings revisions breadth across countries has surged to the top end of the range. Notice what happened to global equities when it did this in the early-90’s (correction), and then again at the peak of the dot com boom in 2000, and 2018, and 2021. Excessive analyst optimism can be more of a sentiment signal than a fundamental signal (also check out what happened when that red line crashed to the lows and ticked up).
The exceptions of the early-2000’s and the rebound out of 2008 were truly good signs, but seeing strength in earnings revisions early in the cycle and coming out of recession is normal and healthy. Seeing surging earnings revisions and overheated sentiment late in the cycle is a bad sign.
Source: Weekly Macro Themes - 30 October 2026
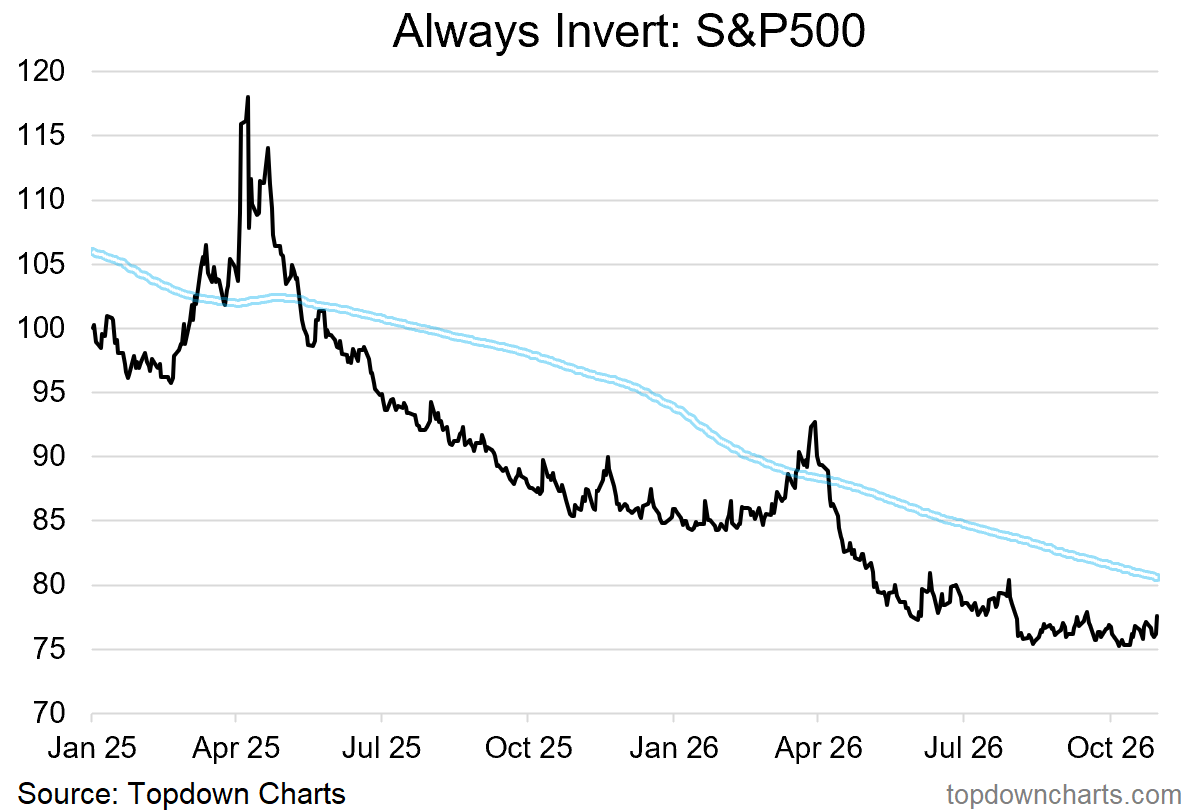
8. The Inverted View: speaking of good and bad, check out this chart — does it look like it’s bottoming? Maybe if you didn’t know it was the S&P500 inverted you might think it’s looking like it could be a buy with a potential rounding bottom. Just one of those perspective checks that’s worth doing from time to time.
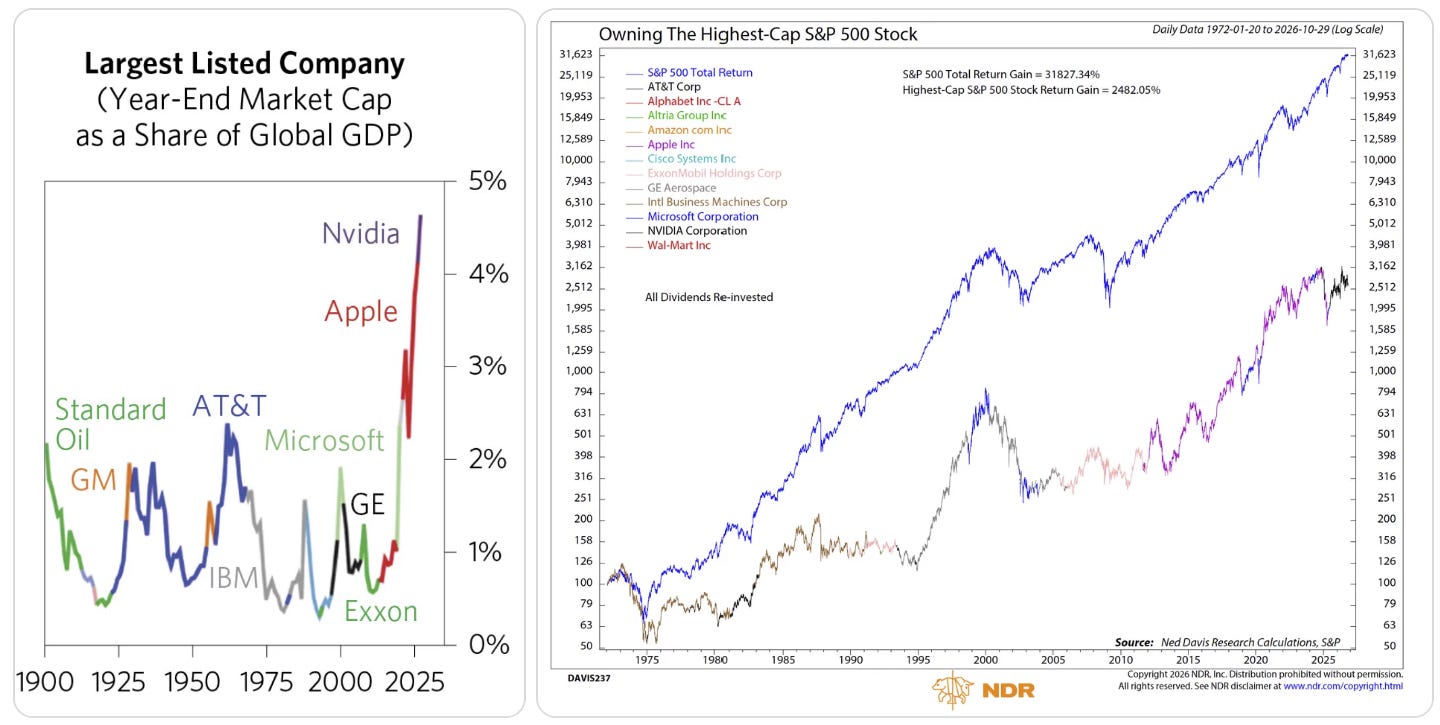
9. High-Cap: this juxtaposition of charts from Meb Faber raises a couple of interesting points, first is the chart on the right shows the performance of buying the biggest stock by market-cap on the right: overall a bad idea, but it has its moments. Second, is how there has been many biggest-of-the-big stocks come and go over time, but also how the recent era has seen basically a breakout in biggening.
Source: @MebFaber
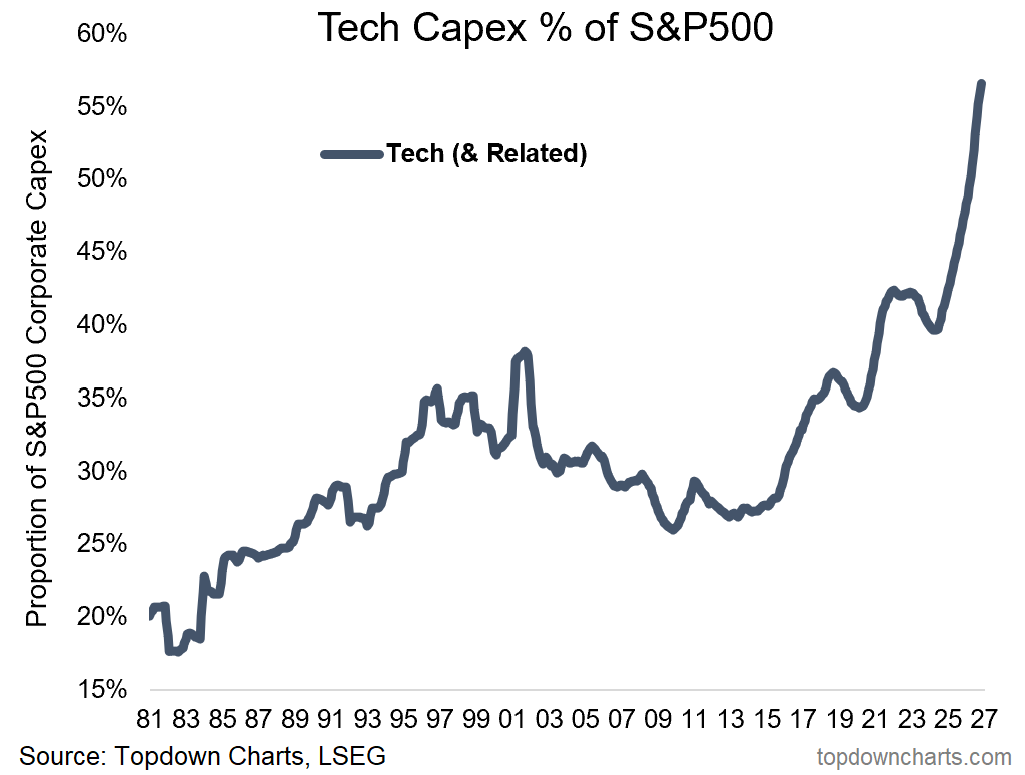
10. Capex Domination: meanwhile tech capex continues to soar to new heights, breaking records on multiple angles, and muscling out all the rest to become the dominant spenders in the S&P500.
Source: Topdown Charts Research Services
Thanks for reading, I appreciate your support!
US Stockmarket Outlook: 5-factor framework
I maintain my previous assessment of: expensive valuations + consensus bullish sentiment + heavy exposure to equities = the background risk setup is dangerous. Despite the Fed hesitation in October, policy remains on a tightening path, which only adds to the risk backdrop. But for now stocks remain in an uptrend, and the earnings/macro story is supportive…
Overall stance: Neutral (increasingly adverse risk backdrop, few remaining supports).

The table above uses the “Topdown Charts 5-Factor Framework” for analyzing macro and markets to give an overall assessment on the US Stockmarket.
Factor in Focus — Macro/Earnings
As noted, the earnings/macro story has been notably supportive for equities with the AI build-out and capex boom supporting a surge in (tech-driven) earnings. There has been some improvement in non-tech as well, and the economy has been relatively robust — but as the chart below shows, earnings momentum is running ahead of economic momentum due to the structural/thematic nature of it.
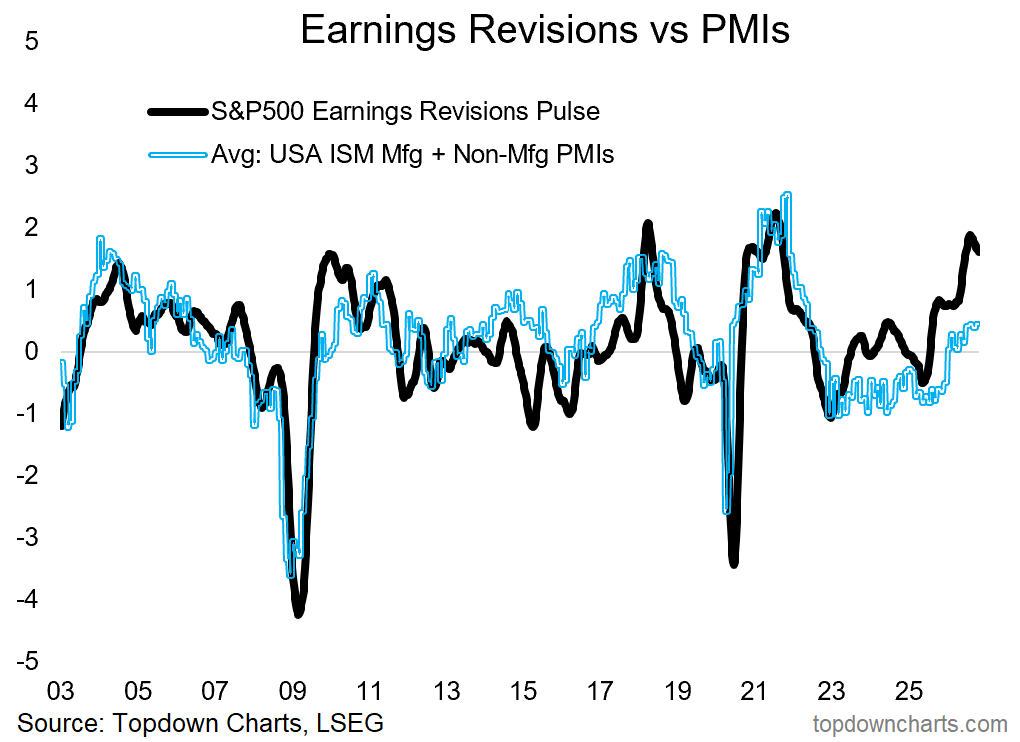
The problem is, again; things look about as good as it gets on the earnings momentum front (already rolling over from very strong levels). And then there’s the point that a lot of US leading economic indicators are pointing to a slowdown in 2027:
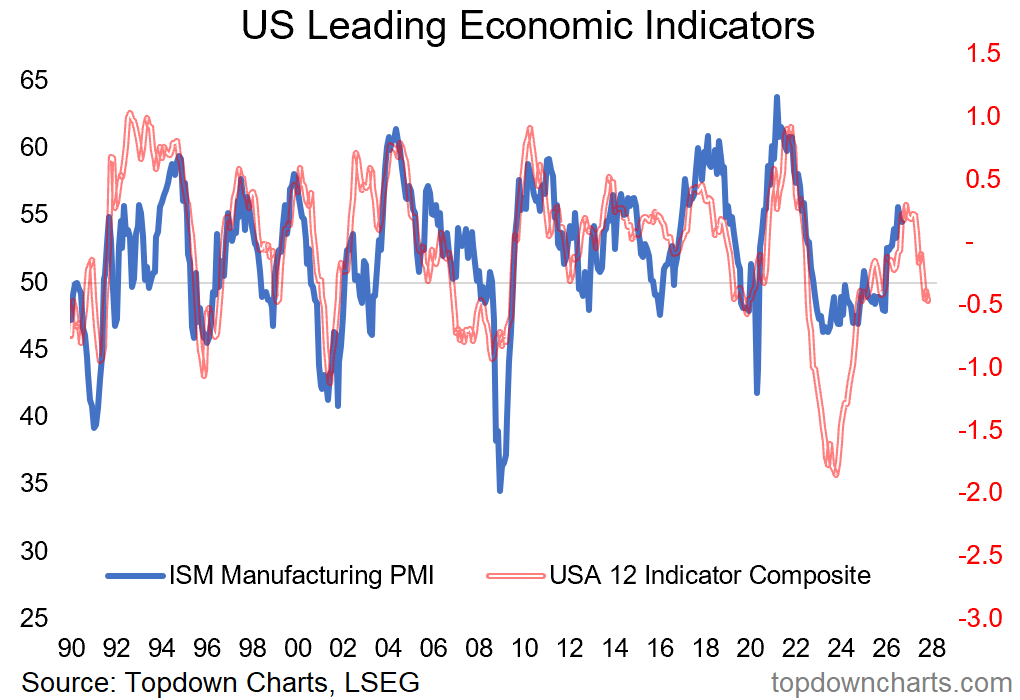
A slowdown doesn’t necessarily mean recession, you can just have a tapering off in activity or a growth scare that doesn’t cut deep. But it is risky territory, particularly when so much of the bull market narrative has been focused on earnings.
It may be difficult for the tech earnings theme to keep pumping at a time when that theme is getting tired and the economy potentially set to soften.
Hence the increased scrutiny we’ve seen recently on the earnings front and the steady whispers of doubt on the AI theme. If the economy goes, then those richly priced valuations that relied on a story of strong earnings growth will need to be adjusted (to put it euphemistically).
—
Best wishes,
Callum Thomas
Founder & Editor of The Weekly ChartStorm
and Head of Research at Topdown Charts
In case you missed it, also see last week’s edition:


.