
Oops! [Weekly ChartStorm: CORRECTION]

CORRECTION: The latest Weekly ChartStorm was sent out as “5 Jan 2024” — I can confirm that the year is in fact 2025 (!)
(…and I guess, also a PSA: remember to update the year to 2025)
As a small token, please see the bonus chart section from the latest edition of the paid/full Weekly S&P500 ChartStorm report, provided complimentary below
BONUS CHART >> got to include a goody for the goodies who subscribed.
Low Down Volatility: I haven’t featured this chart in a while but thought it worth including as it echoes a few of the themes above.
It shows the rolling 12-month count of daily percent changes worse than -1%. In other words, it’s basically an alternative measure of (downside) volatility).
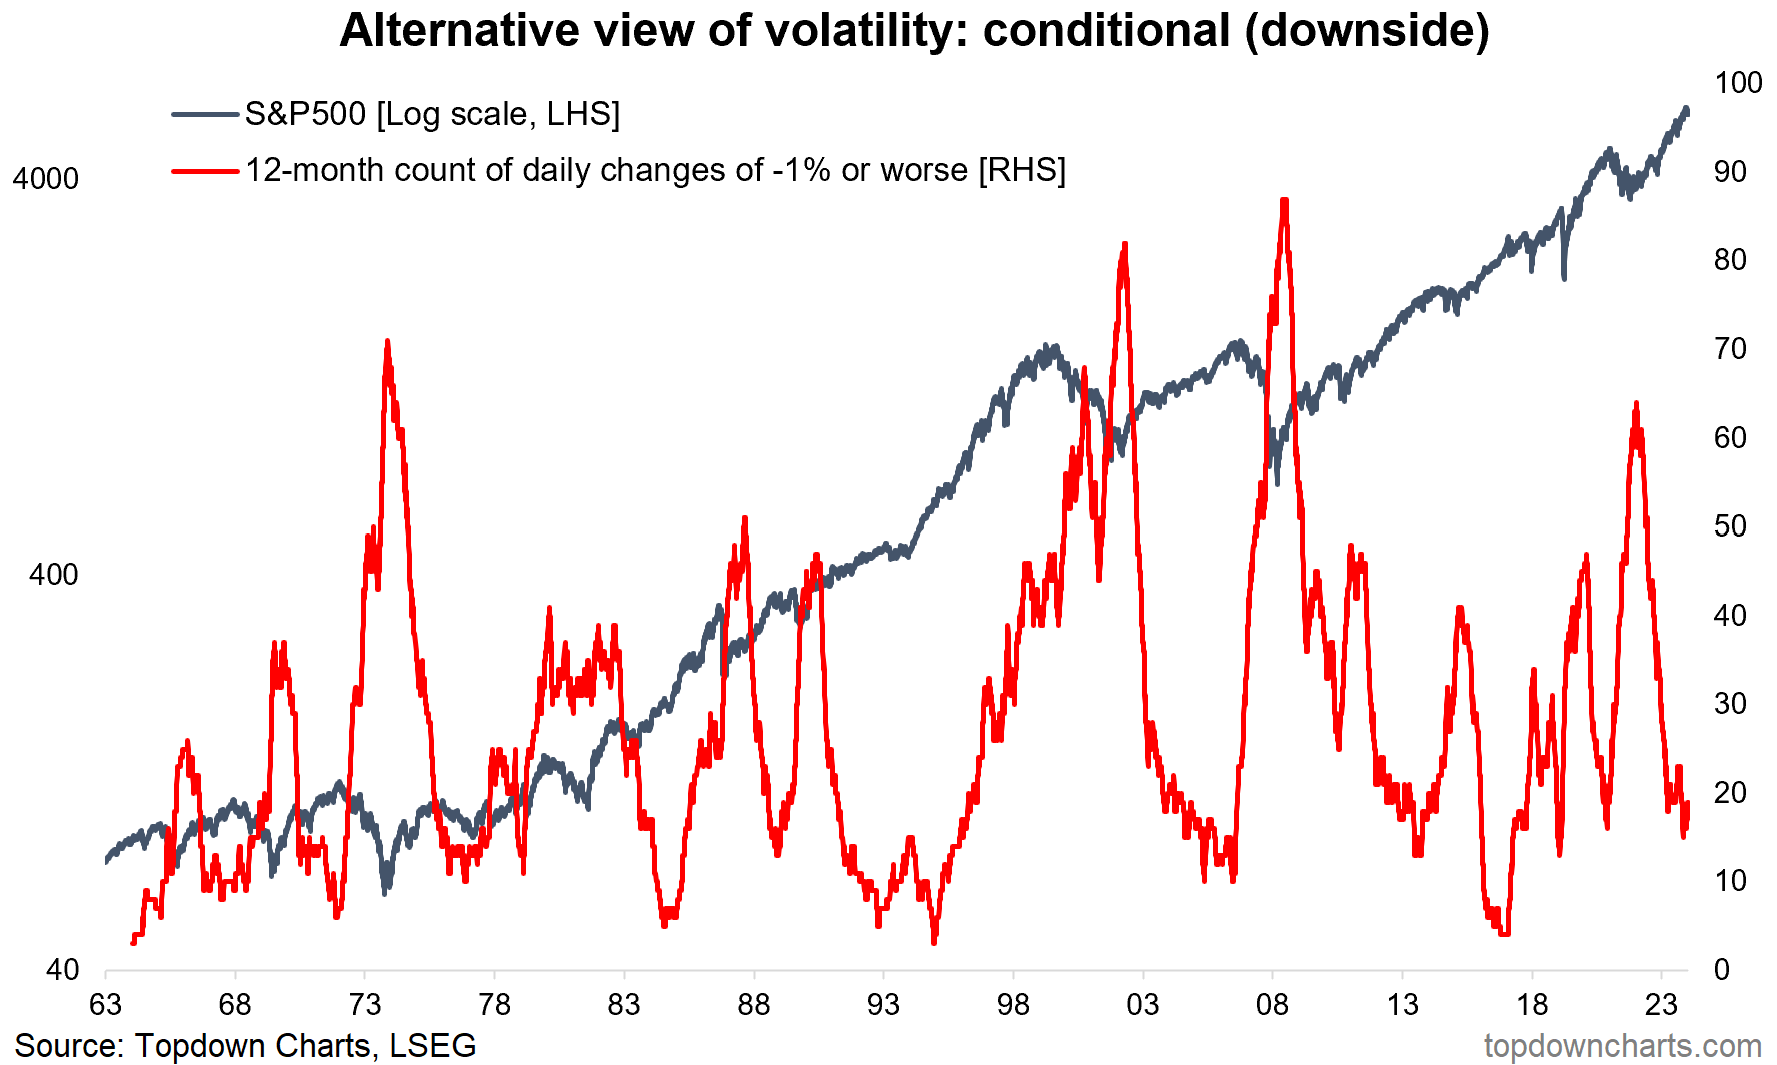
Why is it interesting? It spikes into market troughs, and declines into market peaks.
The dot-com period was a bit of an aberration to this rule of thumb as stocks rose on climbing volatility (a reflection of the frenzied nature of it, and the more speculative earnings/fundamental side of things).
Where this becomes relevant is that it has dropped to low levels, levels usually seen around cyclical market peaks. In general you want to be more bullish when it’s coming down from high levels, and more cautious when it’s bottoming around low levels. So I think this will be an important chart and indicator to keep tabs on this year (along side all the other ones!)
—
Best regards,
Callum Thomas
ALSO, I can confirm the current Anniversary Special Rate for a paid subscription is US$50/yr (vs the usual $120/yr) [p.s. reminder to subscribe!]
Learn more about this special offer + what’s included in a paid subscription + the story of the ChartStorm (and what paid subscribers say about it).