Off-Topic ChartStorm: Valuations in Focus
This edition focuses on equity market valuations
Welcome to another edition the “Off-Topic ChartStorm“.
Unlike the usual weekly ChartStorm (which focuses on the S&P500 and related issues), the Off-Topic ChartStorm is basically a semi-regular special focus piece with topics spanning macro, markets, stocks, commodities, regions, and research notes.
You should expect to see a mix of the timely and front-of-mind issues, as well as some more non-obvious areas under the radar.
Hope you enjoy!
NEW: Sign up to the (free) Chart Of The Week over at the new Topdown Charts entry-level service on Substack: Subscribe to the Chart of the Week
Each week we send you one of the most interesting charts on our radar, along with commentary/context and a key takeaway — so you’re never left guessing on why the chart matters ...and the charts matter! > > > Subscribe Now
1. PE10 Ratio — USA vs the World: This chart shows the PE10 Ratio (price to 10-year average of trailing earnings -- designed to smooth out the sometimes wild gyrations in EPS through the cycle) for the USA as well as the median PE10 across 46 countries (aka “global“).
We’ve clearly seen a big reset in the USA... (but) it is still high vs history and vs global peers, and probably the most tricky element is that it didn’t revisit the absolute lows of the previous two major market drawdowns.
Source: Chart of the Week - Not Expensive, But Not Cheap Yet
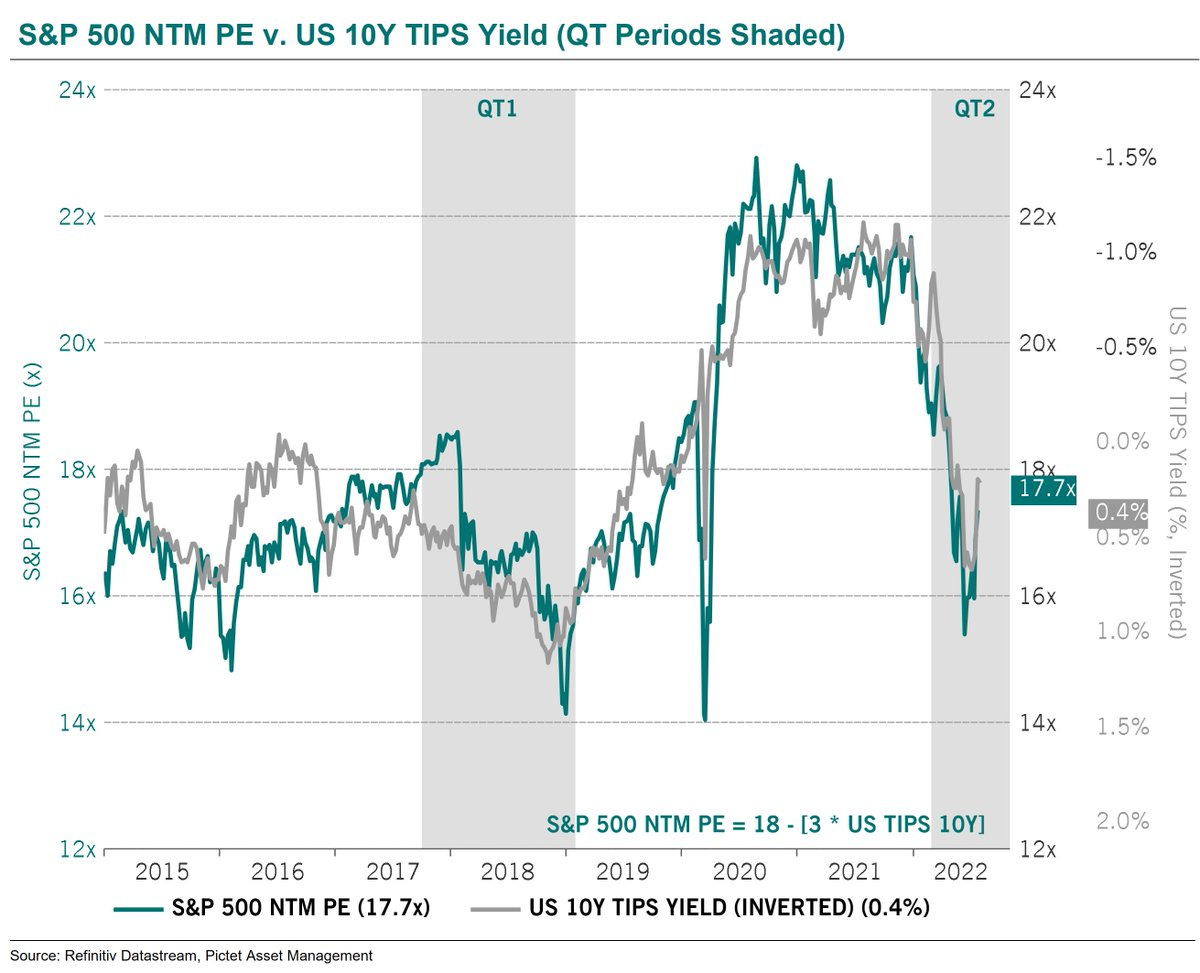
2. S&P500 forward PE ratio vs 10-year TIPS real yields (inverted): Basically this chart is implying, at least in this window of time, that it's all about the mopo (monetary policy and liquidity settings).
…ignore PE, explore real yield?
Source: @steve_donze
3. Forward PE in Focus: On the topic of forward PE ratios... The green line in the chart below (i.e. the cheapest parts of the market) went to levels that you would probably call "cheap", however the red line (most expensive parts of the market) only came down to a higher plateau.
Source: @topdowncharts
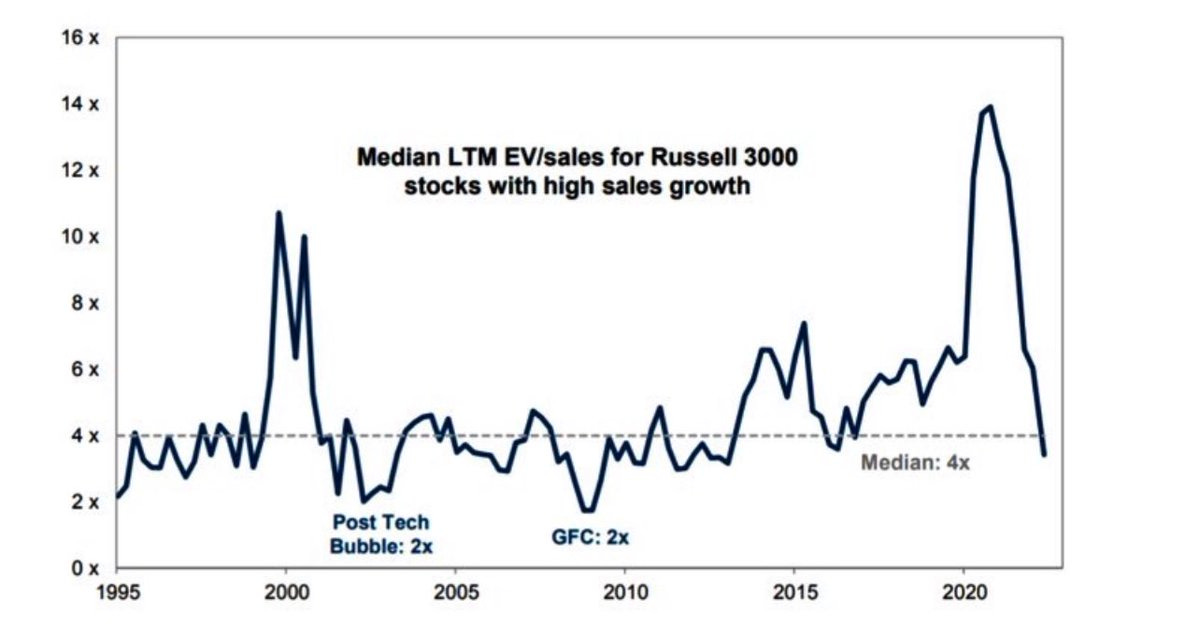
4. Growth Stock Valuations: On a similar note, growth stock valuations are no longer expensive, but are still a ways off the absolute lows of the last two major bear markets.
Does this matter?
Should we expect/demand a return to those levels?
(one argument in favor is that the macro backdrop of high inflation, monetary tightening, geopolitical risk, recession probability would behoove a greater valuation cushion to compensate for the risk picture)
Source: @Marlin_Capital
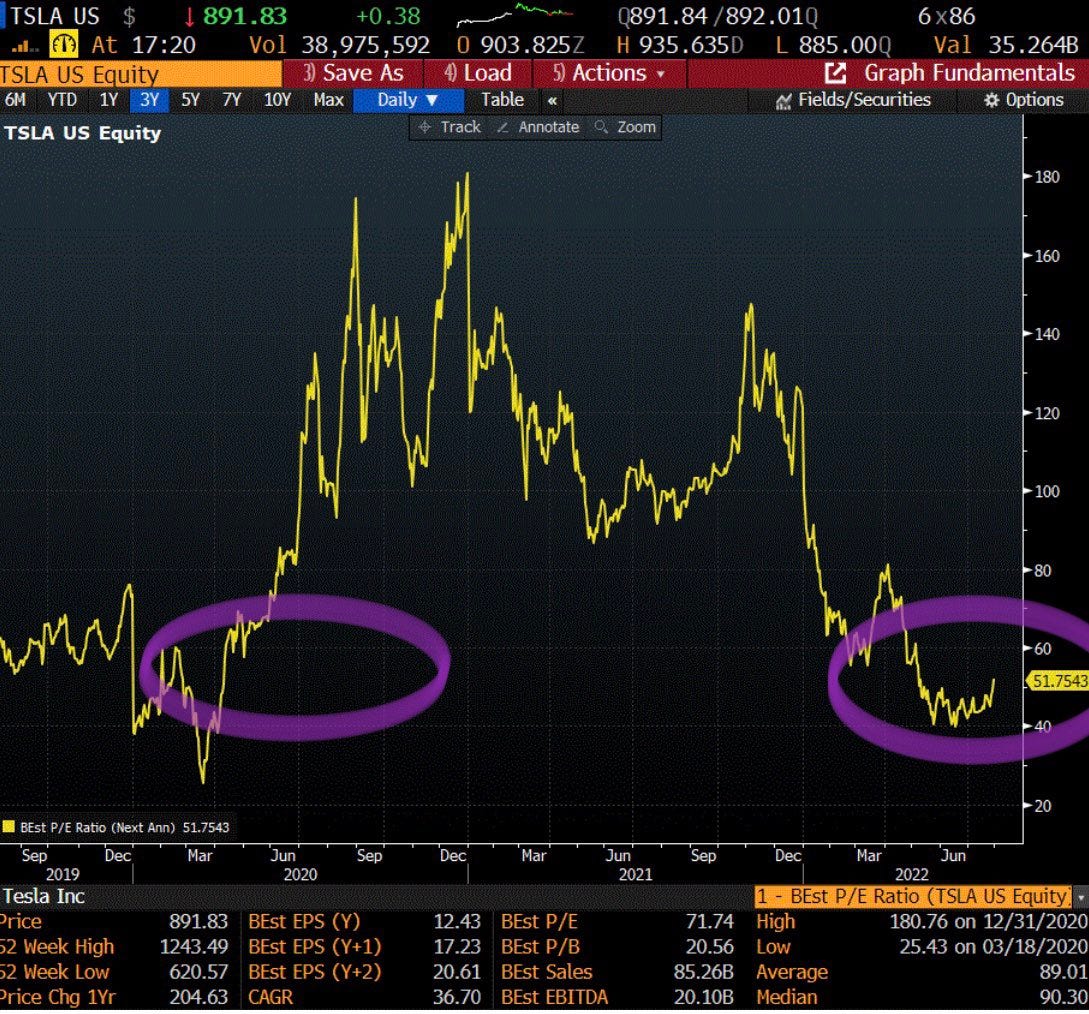
5. Growth Stock Value: Further on growth stocks... Tesla cheap? 🤔
Gary Black of the Future Fund LLC points out: "average 2-year forward P/E is 89x. At its current 2023 P/E of 52x, TSLA has not traded this cheap since April 2020, in the middle of the Covid-recession."
Which is a good juncture to note that a lot of things go into the cheap vs expensive discussion (which can vary a lot whether looking at the index vs individual security level), including (among other things): growth rates, bond yields, lookback period, monetary conditions, investor sentiment, etc!
Source: @garyblack00
6. Price to Sale Proliferation: Further point on growth/expensive stocks: "market cap of stocks with a Price/Sales ratio >10x went down from 14T$ to about 4T$ just to rally to 8T$ again." It seems clear that the market is not yet ready to give up on the valuation excesses of the past couple years.
Source: @KailashConcepts via @MichaelAArouet
7. Value-Growth Relative Value: On a similar note (echoing the previous charts), despite some initial progress there remains a bunch of valuation excesses that have *not* yet been corrected... especially Relative Value (e.g. chart below which shows "growth" still extreme expensive vs "value").
Source: @CliffordAsness
8. Small Cap Relative Value: Exhibit 2 on relative value extremes — big value in Small Caps vs large caps. Basically this is yet another thing that did it like dot-com on the way in, but not on the way out (yet?).
Source: @MikeZaccardi
9. Equity Risk Premium: Stifel suggesting that the ERP can/could/should go lower... (which if equities did all the heavy lifting would mean a renewed bull).
As a side note, while this version of the ERP did not rise to cheaper levels (hardly moved during the H1 bear because bonds also bear’d), it is still positive (implying stocks cheap vs bonds), and is elevated vs recent history.
Source: @SethCL
10. Absolute vs Relative Valuations: Further on the ERP, my version shown inverted below is basically presenting a neutral valuation signal (neither cheap nor expensive vs history), while absolute valuations (combined PE ratio) is still on the expensive side.
Again, the problematic aspect of this is that the ERP did not move materially, and certainly did not lurch to the cheap side like it did in March 2020. So again we are left saying something to the effect that yes valuations are not as egregiously expensive as they were during the peak of the post-pandemic bubble, but they are not yet compelling cheap “close your eyes and buy“ sort of levels.
And that leaves us in a bit of a conundrum as the macro backdrop, as alluded to earlier, is not exactly friendly AND valuations are not compelling (unless some sort of goldilocks: lower inflation, but steady growth, pause in tightening, recession averted, capex rebound, consumer contentment, middle-ground sort of scenario emerges which allows stocks to have another go at it, or at least benignly range up to the right).
Source: 12 Charts to Watch in 2022 [Half-Time Update]
Thanks for following, I appreciate your interest!
My research firm, Topdown Charts, has a new entry-level Substack service, which is designed to distill some of the ideas/themes/charts from our institutional research service to provide the same high quality insights at a more accessible price.
Give it a try and let me know what you think! :-)
Relevant Tickers: SPY 0.00%↑ ACWI 0.00%↑ VOO 0.00%↑ IVV 0.00%↑ IWM 0.00%↑ TSLA 0.00%↑ XLK 0.00%↑ SPYG 0.00%↑ SPYV 0.00%↑ VLUE 0.00%↑


