Off-Topic ChartStorm: US Treasuries
Bond market update: drawnout drawdowns, bond yield outlook, cash rates, macro indicators, inflation risks, and implications for the stockmarket...
Here’s a quick “Off-Topic ChartStorm” on US bond yields.
Unlike the usual weekly ChartStorm (which focuses on the S&P500 and related issues), the Off-Topic ChartStorm is a semi-regular focus piece with topics spanning macro, markets, stocks, bonds, commodities, regions, and various other issues of interest.
Learnings and conclusions from this session:
On the technicals, bond yields are caught between short-term support and resistance, but the upward momentum is fairly clear and compelling.
The PMIs however point to (much) lower bond yields ahead.
Yet the long-term inflation model says higher for longer.
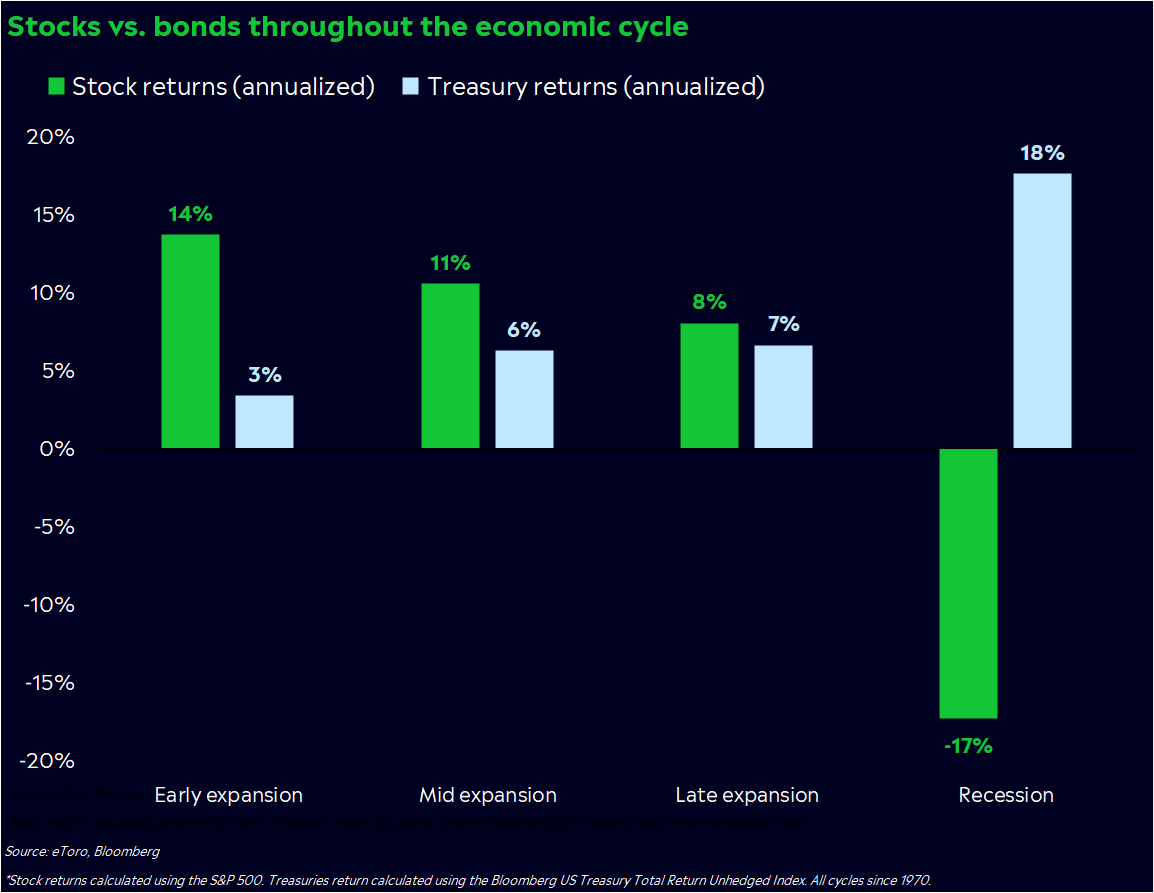
History tells us treasuries outperform in recession and bond bulls need to wait for the Fed to pause and/or ideally pivot to rate cuts.
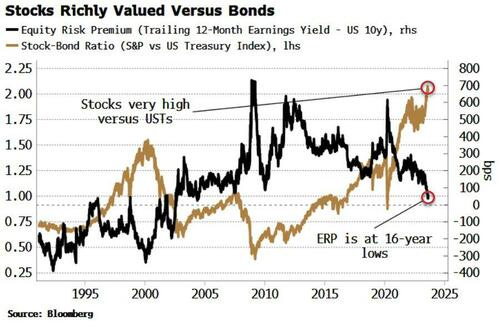
Meanwhile, stocks look stretched vs bonds (+at risk if yields push higher).
Overall, there’s definitely a case to be made for some further upside in bond yields, but equally building evidence for the downside case. I would say it’s just a matter of timing, and in that respect we need to listen to price while keeping macro in mind.
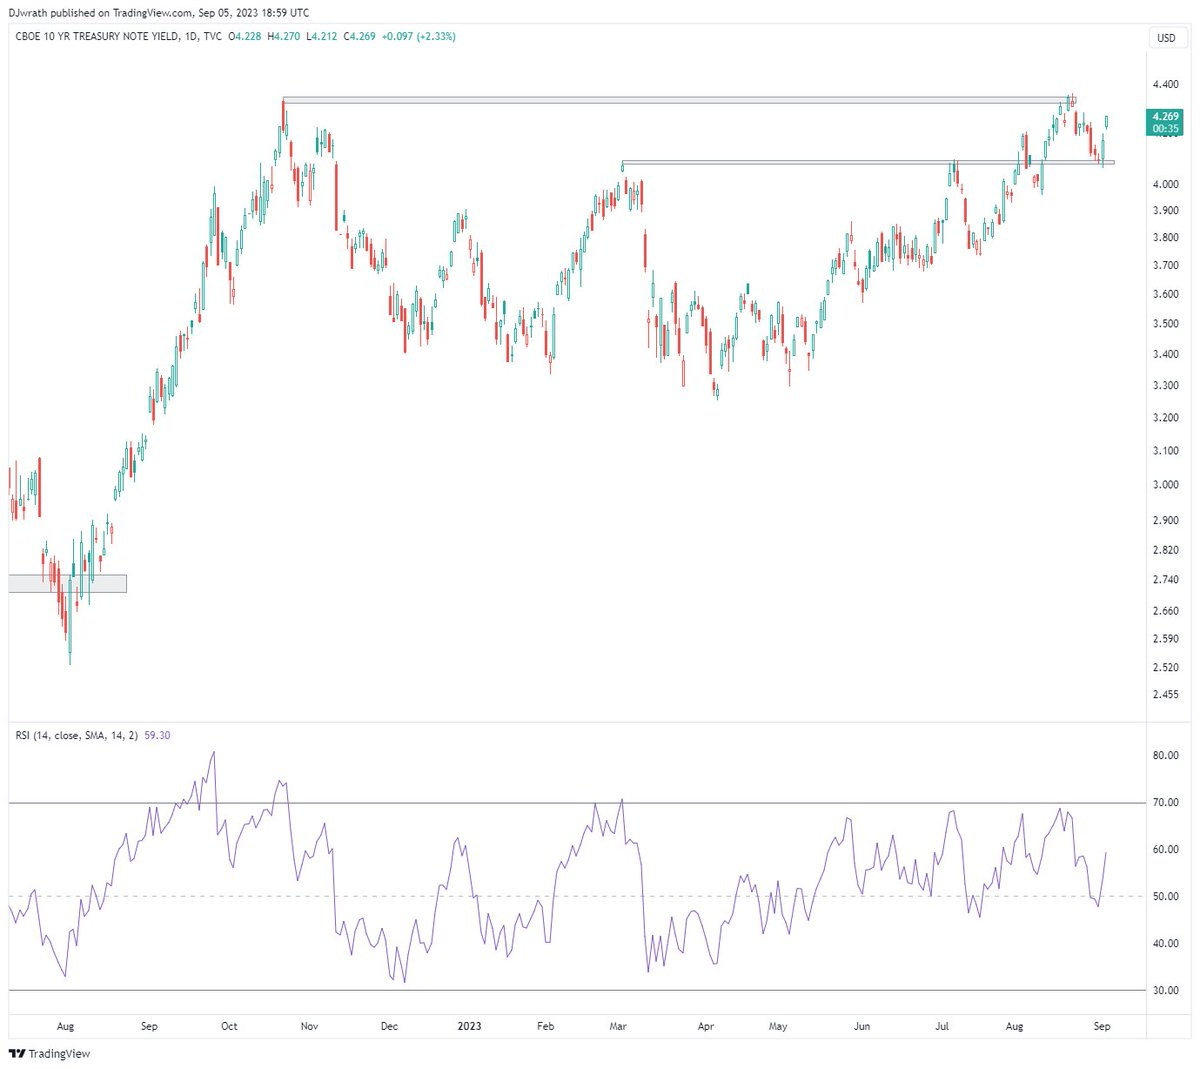
1. Bond Yield Technicals: I thought this one would be a good starter as it lays out the tactical situation for US 10-year bond yields. The first point to note is actually the steady uptrend that began off support from around May this year (which also involved it breaking above its 50-day moving average, and flawlessly maintaining that textbook breakout ever since). But of interest with the annotations in the chart is the recent initial rejection of resistance, and bounce off short-term support. These are important trigger levels in my view, if we break that upper resistance level then we go to new highs in bond yields, while a break of support (and the 50dma) would place a move lower in yields on the table. Given the strong upward momentum in yields, the odds would favor a break higher.
Source: @DJwrath
2. Treasury Troubles: In real (CPI adjusted) total return terms, long-term US treasuries have seen a lost decade, and a catastrophic -50% drawdown off the peak in mid-2020 (p.s. for anyone who’s new to bonds remember: yields up = price down). Essentially this is what happens when an otherwise safe and conservative asset meets an inflation (+ monetary policy) shock.
Source: Chart Of The Day - Treasuries Troubles
3. Treasury Troubles in Context: Not only has it been a large drawdown, it’s been a drawn-out draw-down, and as things currently stand the YTD negative returns put treasuries on track to chalk up their 3rd year in a row of negative returns — for the first time in recorded history.
Source: @KobeissiLetter Daily Chartbook
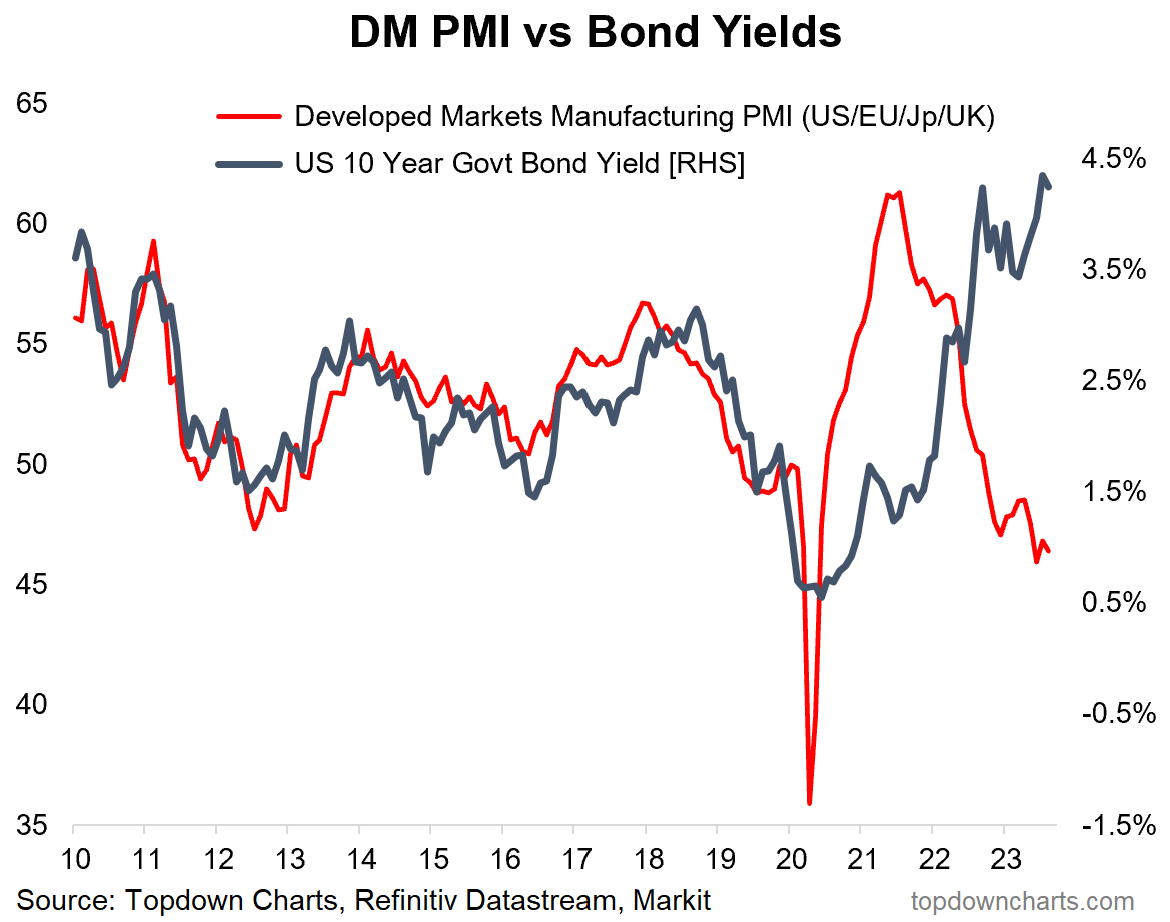
4. When Buy Dip? But it is important to note that the year is not out yet, we’ve got 4 months for treasuries to make a comeback, and one reason for hope would be this chart here. It shows the recessionary declines in the developed market manufacturing PMIs pointing to (if we were to take the chart literally) US 10-year yields falling towards 1% — something that I think at this juncture most would find unbelievable.
Source: Topdown Charts Topdown Charts Professional
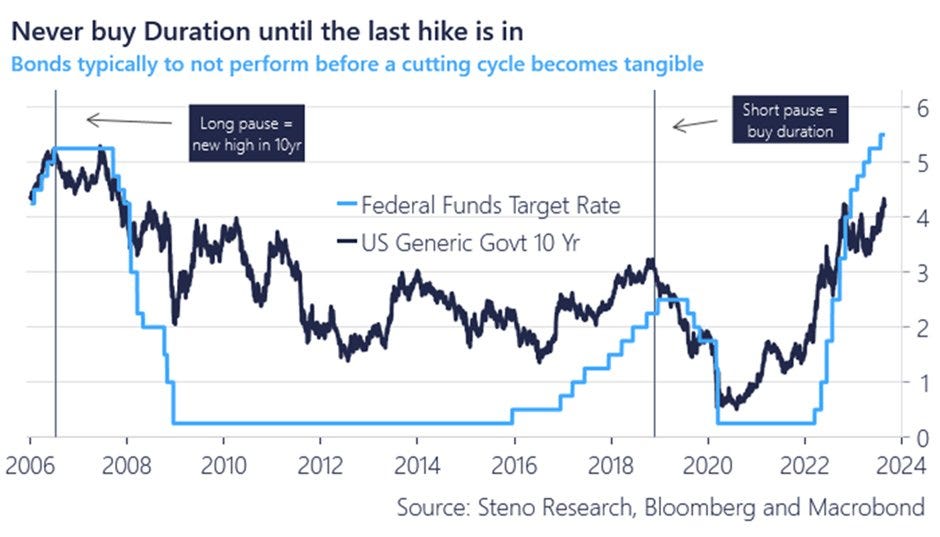
5. When Fed Pause/Pivot: But even as some of the macro indicators say bonds look attractive (i.e. expecting lower yields — which again for the newbies, would mean higher bond prices), history tells us bond bulls should be patient and wait for Fed pause/pivot. And well, I would say unless we get another inflation shock or resurgence or some kind of upside macro surprise, the Fed is probably darn near close to pausing at least.
Source: @AndreasSteno Stenos Signals
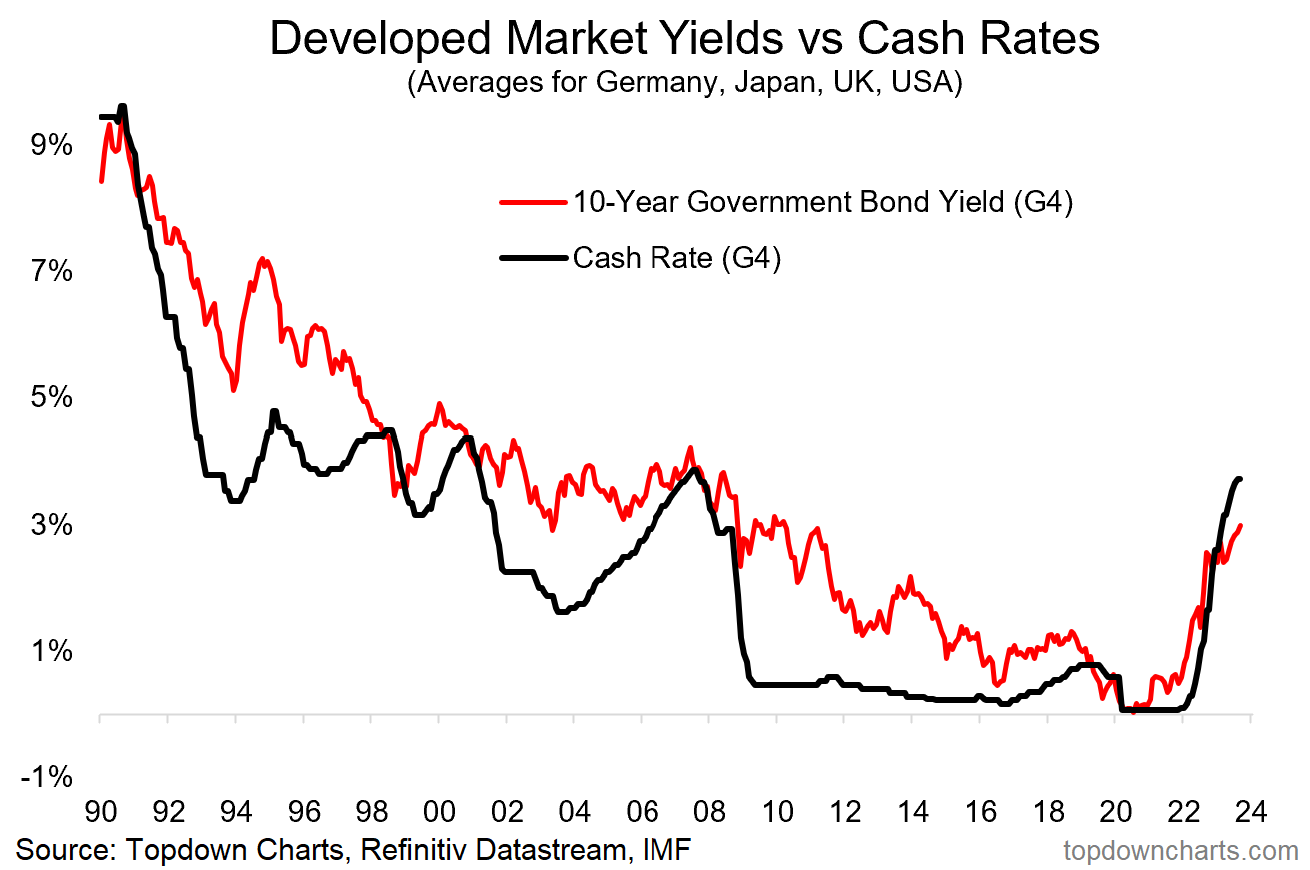
6. Cash Rates vs Bond Yields — Global Perspective: Indeed, it’s not just the Fed, if we look across developed markets through time, for bonds to sustainably perform and yields to move lower, you really do need to see cash rates peak and for central bankers to shift into rate cutting mode (which, by the way, EM central banks are already in the early process of doing so, after being first to pivot to hiking back in 2021).
Source: Chart of the Week - Bond Yields vs Cash Rates
7. Recession Realities: But one thing I have to keep coming back to is the tyranny of the stats — historically treasuries put in their best performance, and stock-beating performance during recessions. I would note, you don’t need a recession for bonds to do ok, but you do need a recession for bonds to do spectacular (hence why bonds are often referred to as diversifying assets… at least outside of inflationary shocks!).
Source: @callieabost
8. Higher For Longer Tho? This chart presents the cautionary — the long-term rate of inflation model is still suggesting some upside for US 10-year yields. I would note that the indicator does appear to be peaking, but higher for longer can still be true if inflation just maintains (vs accelerates). And with that big break vs long-term downtrend, it’s easy to see why a lot of people are still bearish on bonds.
Source: Chart of the Week - Bond Yields Higher For Longer?
9. How Does this tie-in to Stocks? One key implication of rising yields has been shrinking equity risk premiums [ERP] (i.e. the expected premium required over and above the risk free alternative to compensate for taking on equity risk). As a rule of thumb, stocks are generally a good buy when the ERP is high (especially when it spikes to record or multi-year highs), where as stocks are generally a good bye when the ERP is low. So higher yields put stocks at risk when the ERP shrinks, and make it relatively more attractive to own bonds vs stocks.
Source: @MikeZaccardi
10. Stocks vs Bonds: And with such dismal performance by bonds, and a storming run in stocks off the October 2022 lows, the stocks vs bonds ratio has broken out to new highs and indeed looks overbought on a number of metrics. But again, the relative value situation increasingly favors bonds and disfavors stocks.
Ultimately though, and again, I did the math — historically it is far more likely for bonds to outperform stocks when stocks are falling (vs rising), and back to that recession comment (chart 7)… realistically for bonds to really outperform vs stocks you need a recession and/or bear market in stocks. At the moment all we’ve got is a bear market in bonds, a bull market in stocks, and a no-landing/non-recessionary-recession (for now).
Source: Stocks Are Overbought Relative To Bonds
Thanks for following, I appreciate your interest! Please forward or share this post.
Looking for further insights? Check out my work at Topdown Charts






Thank you!
Thanks, very insightful!