
10 Charts to Watch in 2023 [Half-Time Update]
The key macro/market charts for navigating risk vs opportunity this year...

Here’s a quick update to my 10 Charts to Watch in 2023 article as we head into the second half of the year.
In the original post I shared what I thought would be the 10 most important charts to watch for global multi-asset investors in the year ahead (and beyond). In this article I have updated those 10 charts, and provided some updated comments on the outlook as I see it.
[Note: I have included the original comments from back at the start of the year, so you can quickly compare what I'm thinking now vs what I said back then!]
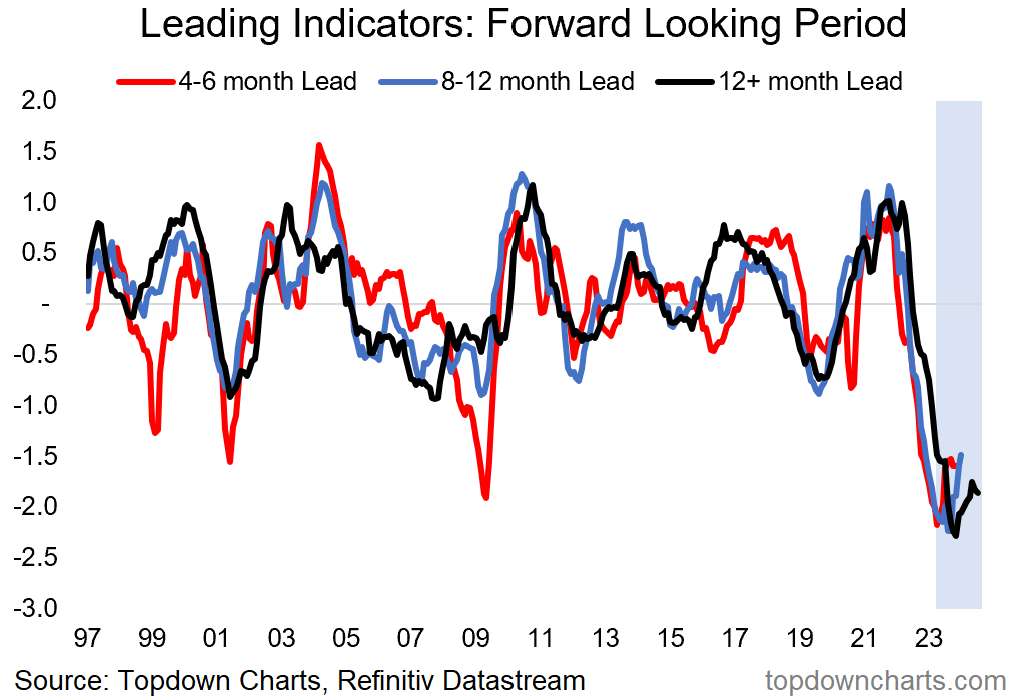
1. Global Recession 2023: As of the latest data, the majority of the 20 leading indicators I track still point to recession. This is true across regions, factors, and lead-time windows. The headwinds from cost pressures have significantly reduced (thanks to lower commodity prices), and some short-term demand indicators have rebounded off the lows, but monetary and central bank related factors have deteriorated further — pointing to a monetary wall facing the global economy in H2.
So I think it is too early to declare victory on “recession-averted” as some parts of the economy remain stronger than expected, because the global economy still faces considerable downside risks as central banks are now overcooking tightening, just as they overcooked it on easing in 2020/21.
“One of the most interesting pieces of work I undertook in 2022 was to perform a sort of meta-analysis on all the leading indicators I’ve developed over the years. The key takeaway from that is whether you group leading indicators by type/factor, geography, or forecast window — they are all unanimous in pointing to a sharp downturn heading into early-2023. In many ways it’s a coming full circle of the massive stimulus that was unleashed in 2020. Or as I call it: “a strange but familiar cycle”.”
2. Double Trouble: Staying with the “monetary wall” theme, this chart highlights the issue quite well as it shows how borrowing costs are surging just as credit conditions are also tightening. I think it’s hard to argue for a benign outcome in the face of evidence like that presented in this chart (credit rationing, tighter funding conditions) — at the very least, the weak spots will be exposed.
“I include this one because it goes to show how financing conditions have tightened — banks are becoming more stringent and stingy in their lending decisions, and the interest rate on those loans is now a lot higher. So it's a situation of even if you can get a loan, you might not be able to afford it! If we do get a recession this year it could be the last straw for some of the more unsustainable business models that arose in the world of zero interest rates, and credit stress could become a key issue.”

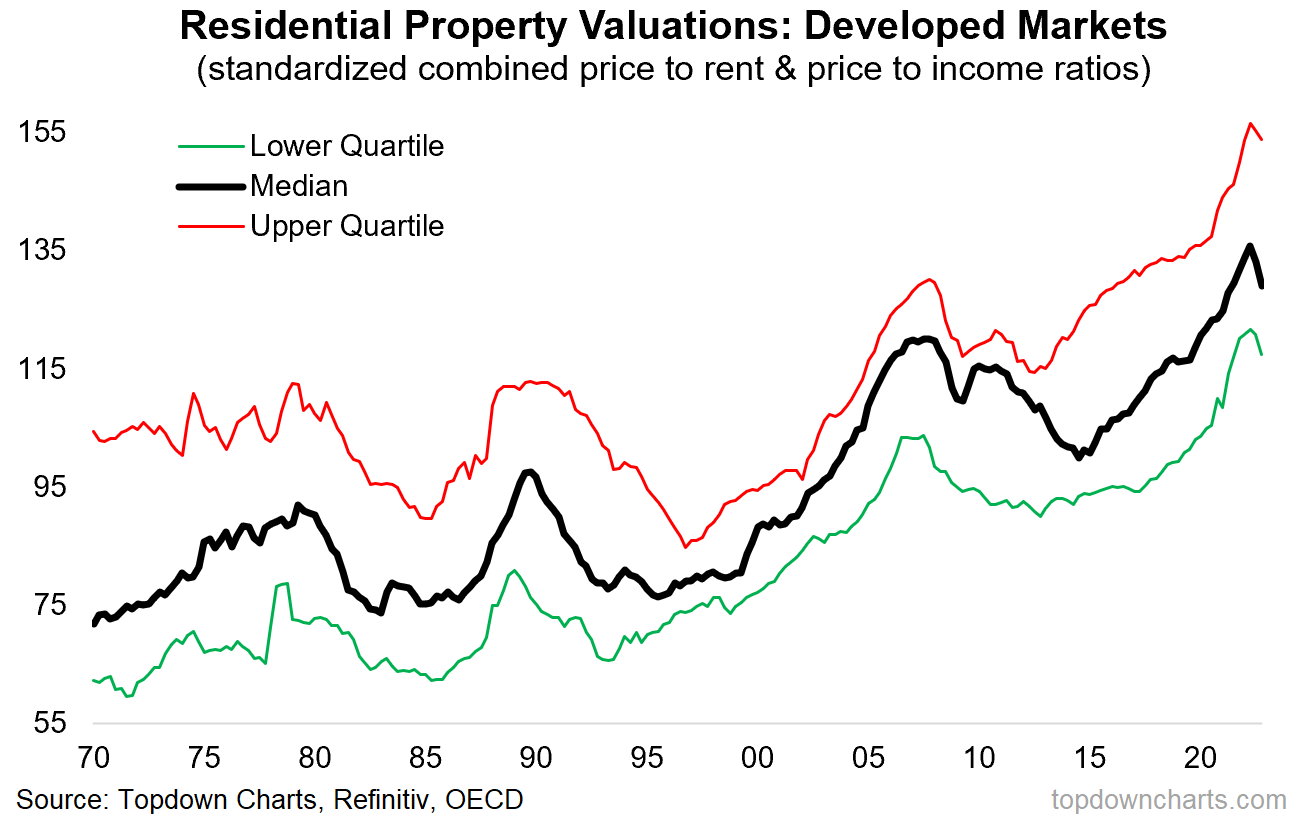
3. Property At Risk: Interestingly housing market valuations are actually starting to correct — partly due to malevolent effects (falling house prices), and partly to benevolent effects (rising incomes). Which is another way to say, you don’t necessarily need a housing collapse to correct historically extreme expensive valuations …you can get there just by house prices staying steady and incomes rising. But a situation of higher for longer interest rates will stress this process.
“Housing market valuations reached a record high across developed markets last year. That’s going to be a problem if rates stay high or head higher (and if real incomes continue to squeeze). Key risk to monitor.”
4. Unflation: Inflation is on the decline due to the commodity bear market, normalization of global supply chains, and increasingly also as demand softens. That’s mostly about headline inflation, and headline definitely effects core, but the key for core inflation from here is demand destruction leading to a freeing-up of capacity.
As economic sentiment rolls over again after a brief rebound, the gap in this chart suggests capacity utilization (labor + industry) catches down.
“The downward drift in commodity prices is already going to dampen headline inflation, but a recession will seal the deal (the fastest way to free up tight capacity is demand destruction: central banks understand this).”

5. Bond Yield Go Down: So there has been some rebound off the lows in the macro indicators in this chart, but then the indicators still point to major downside for bond yields. Maybe we just have a longer lead time — perhaps similar to how bond yields traded on the upside previously.
“Weaker growth, credit stress, housing market issues, lower inflation… it’s all a recipe for lower bond yields. If we take my macro models literally then US 10-year bond yields could head back below 2.0% (even as low as 1%?!) by the middle of this year. Sure, there’s a lot of if’s and but’s around that, but an interesting forecast being suggested by the data, and it fits with the macro (and valuations).”

6. Bonds Beat Stocks: Thanks in part to AI-hype (combined with previous excess pessimism), stocks have been outperforming bonds. But again, on the “monetary wall“ vs the economy theme, this may not last as the monetary conditions indicator points to bonds significantly beating stocks over the next 12-18 months.
“On valuations, treasuries are cheap, and stocks are not. By itself that means bonds have the advantage, but bonds also disproportionately benefit in the event that global recession does indeed set in. The leading indicator affirms this notion in the chart below.”

7. Monetary Risk to Macro Risk: Some might be pointing out by now that markets already reacted to monetary risk last year. And indeed, the key ingredient if stocks are to underperform bonds will be for recession to set in. And as it turns out, the hard data is rapidly decelerating (and soft data is dropping again after a brief bounce). Beware of bad macro.
“Arguably much of the pain in equities last year was down to the rates/inflation/monetary shock. Recession risk means slowing growth is set to become the bigger concern this year.”

8. Tech Unwind: As earnings share of the techy sectors has declined further, market cap weighting has… increased! The tech sector unwind has unwound. Although you might argue that AI hype has just delayed the inevitable on this one.
“Definitely different from the dot com bubble, but definitely also some excesses that needed to be unwound. My sense is we are still just over midway through this process, and ultimately: growth stocks can’t outgrow the macro.”

9. EM Stocks & Bonds: Despite the rebound already, I still think this is an overlooked corner of the markets — EM sovereign bonds likely gain significantly as EM central banks begin to turn the corner on rate hikes. EM equities also look good, despite a false start as seemingly everyone’s favorite asset class at the start of the year.
“When it comes to emerging markets, the equities are looking somewhat cheap, but what’s really interesting is where the bonds got to. There is what appears to be a major once-in-a-decade value setup for emerging market sovereign bonds (I am talking at the asset class level, equal-weighted). I think this could be one of those moments in time for asset allocation, but a few things do need to go right for this one to work.”

10. China Policy Map: Speaking of turning the corner on interest rate hikes, China has finally delivered with a 10bp rate *cut* this month, and the inflation composite for China suggests the PBOC has ample scope to cut further. Similarly, LatAm policy rates have as a group basically peaked, so it seems the pivot to rate cuts will start in the same place as the global pivot to rate hikes originally began (EM as a group were first to hike, and now are first to pivot to cuts).
“With China transitioning away from zero covid to zero cares about covid, the door is opening wider and wider for more forceful stimulus. The property market downturn, global growth risks, and clear disinflation trend makes for a classic and compelling case for monetary easing. Amid an otherwise gloomy outlook for 2023, this could be a key bright spot for macro and markets if they do step up stimulus. So keep an eye on China macro.”

Summary and Key Takeaways:
-Leading indicators still point to recession (with a “monetary wall“ in H2)
-As a result (and along with tighter funding conditions), credit stress and real estate market risks are likely to remain a hot topic
-Weaker growth reinforces lower pricing pressures (maybe even deflation risk)
-All of this supports the idea that bonds rally; 10yr yields could move sharply lower
-For stocks it’s a situation of moving from the monetary/inflation shock of last year into macro risk this year, and stocks likely underperform vs bonds as bonds rally and stocks deal with a prospective global recession [albeit a few big *ifs* here]
-EM assets (stocks and sovereign bonds) look promising, but a few things need to go right, such as a peak in EM policy rates and extension of US dollar weakness
-Despite the mostly gloomy prognosis, there remains ample opportunities for active asset allocators as the cycle progresses and risk vs reward balance shifts
Overall: I would repeat my quip of this being a “strange but familiar cycle”, particularly in that a lot of the usual macro/asset allocation sign posts that we usually follow continue to work (albeit with some nuance) and are pointing fairly clearly to the next steps. Hence from an asset allocation standpoint I’d be overweight defense (cash and government bonds) vs underweight growth assets (equities, commodities, credit) given the weight of risks, despite the big shift in sentiment in H1 (everyone’s bulls now that price is going up again!).
—
Thanks for reading! Thoughts & Questions welcome in the comment section ↓
n.b. these charts were first featured in my 2022 End of Year Special Report — click through for the full report (free download)
Best regards,
Callum Thomas
Head of Research and Founder of Topdown Charts
I have a meme in my mind of a person holding a stick and poking a "EM stock basket" saying "do something" :) that's how I feel following them. South America showed some life earlier this year and China finally had a bit of a move, but otherwise it's still been 'meh'. Patiently keeping an eye...
Could you make a case for the markets, sans the expected slowdown in the economy, to continue to move higher? Thank you for your insight and content.